Using Pandas DataReader to Access Online Data Sources in Python

Pandas DataReader is a library that allows data scientists to easily read data from a variety of sources into a Pandas DataFrame. This is especially useful for accessing data that resides outside of their local development environment and needs to be accessed via APIs. The Pandas DataReader provides functions for loading data from various online sources, including Yahoo Finance and the NASDAQ. This can be incredibly helpful for tasks such as financial analysis, data visualization, and machine learning. In this tutorial, we will give a brief overview of the library and show how to use it in Python to access financial data from the Yahoo Finance API.
What is Pandas Data Reader?
The Pandas DataReader library provides functions that extract data from various Internet sources into a pandas DataFrame. The pandas DataReader supports several remote data providers, including Alpha Vantage, World Bank, Eurostat, the OECD, and several stock markets such as the NASDAQ, Yahoo Finance, and Naver Finance. A complete list of available sources is available from the pandas DataReader API documentation.

Pandas DataReader is a useful Python library for accessing remote data via an API
Access Financial Data using Pandas DataReader and the Yahoo Finance REST API in Python
In this tutorial, we will learn how to use the pandas library to retrieve data for the German stock market index DAX from the Yahoo finance API. Specifically, we will use the pandas_datareader package, which provides a convenient interface for accessing various online data sources. We will carry out the following steps:
- Install the pandas_datareader package.
- Import the necessary libraries in our Python script.
- Use the data.DataReader function to request data for the DAX index from the Yahoo finance API. Specify the start and end dates for the data you want to retrieve. The returned data will be stored in a pandas DataFrame.
- Finally, we use the plot() method from the matplotlib library to visualize the data.
The code is available on the GitHub repository.
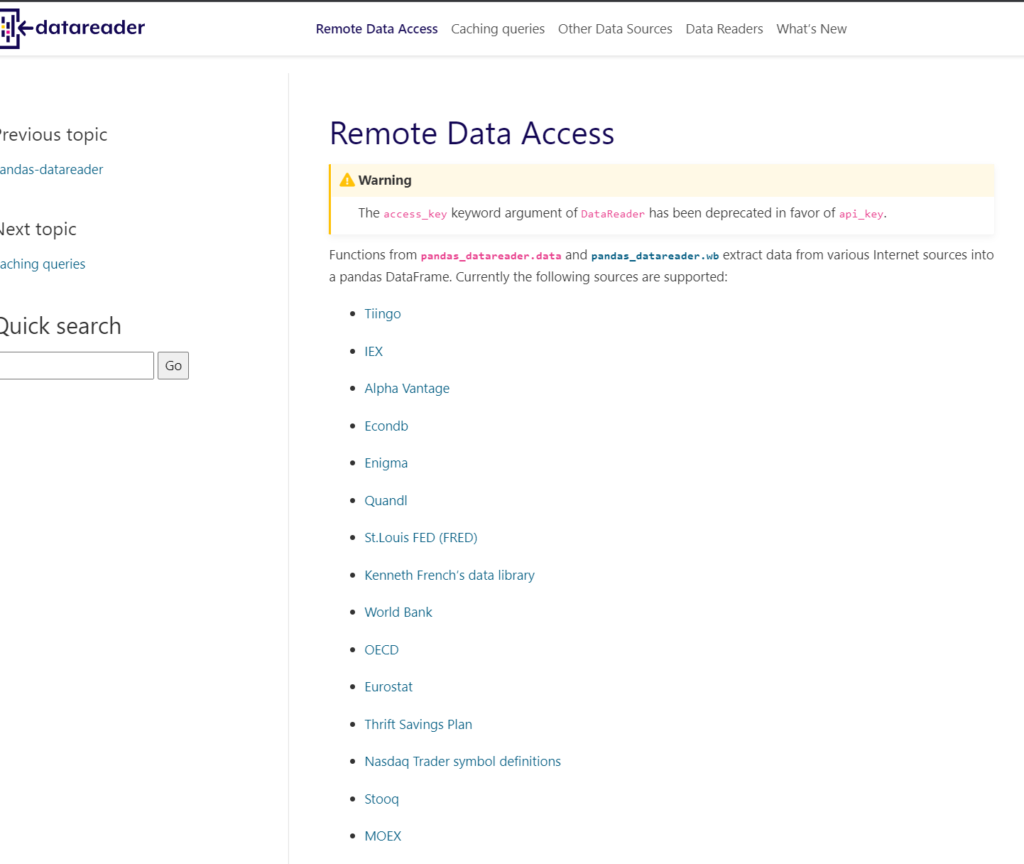
Pandas DataReader provides access to a wide range of public data sources.
Prerequisites
Before starting the coding part, ensure you have set up your Python 3 environment and required libraries. If you don’t have an environment, consider following the steps in this tutorial to set up the Anaconda environment.
Also, make sure you install all required packages. In this tutorial, we will be working with the following standard packages:
You can install packages using console commands:
pip install <package name>
conda install <package name> (if you are using the anaconda packet manager)
In addition, we will be using the pandas DataReader library, which you can install with the following command:
pip install pandas-datareaderStep #1: Define the API Request Parameters
We begin by setting up imports and adjusting the request parameters. The parameters in an API request will depend on the API and the library used for making the request. Also, some parameters may be optional, while others are mandatory.
The Yahoo Finance API allows us to limit the period we want to retrieve price data, an example of an optional parameter. Furthermore, we need to define the ticker symbol for the financial instrument if we wish to request the price data. This parameter is mandatory.
The ticker symbol for the German stock market index is ^GDAXI. If you want to retrieve price data for other stocks or indices, you can search for the respective ticker symbols on Yahoo finance.
import pandas_datareader as webreader
import pandas as pd
import matplotlib.pyplot as plt

# Set the API
data_source = "yahoo"

# Set the API parameters
date_today = "2020-01-01" # period start date
date_start = "2010-01-01" # period end date
symbol = "^GDAXI" # asset symbol - For more symbols check yahoo.finance.com
Step #2: Send the Request to the REST API Endpoint
Once we have defined the request parameters, we can make the request via the DataReader function and print out the result. If you request a REST API, the response will come back in JSON format. However, DataReader will directly convert the API response into a DataFrame, which makes using APIs much simpler.
This will retrieve the DAX stock market index from Yahoo Finance and print the first few rows of the resulting DataFrame. We have specified a date range to retrieve data for a specific period of time.
# Send the request to the yahoo finance api endpoint
df = webreader.DataReader(symbol, start=date_start, end=date_today, data_source=data_source)
df.head(5)
High Low Open Close Volume Adj Close
Date
2010-01-04 6048.299805 5974.430176 5975.520020 6048.299805 104344400.0 6048.299805
2010-01-05 6058.020020 6015.669922 6043.939941 6031.859863 117572100.0 6031.859863
2010-01-06 6047.569824 5997.089844 6032.390137 6034.330078 108742400.0 6034.330078
2010-01-07 6037.569824 5961.250000 6016.799805 6019.359863 133704300.0 6019.359863
2010-01-08 6053.040039 5972.240234 6028.620117 6037.609863 126099000.0 6037.609863Dataframe with the price data from yahoo finance.
Step #3 Plot the Data
Let’s quickly print the data to check if everything looks ok.
# Plot the closing prices
fig, ax1 = plt.subplots(figsize=(12, 8))
plt.plot(df.index, df.Close)
plt.show()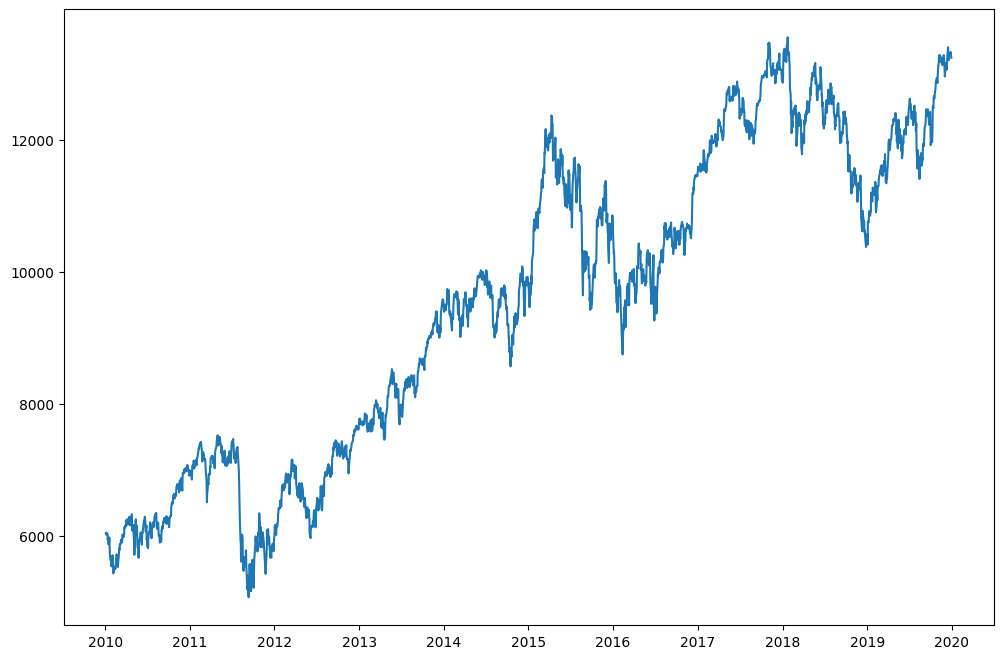
Everything looks good, so let’s proceed.
Step #4: Save the Data to a CSV File
To save the data from a Pandas DataFrame to a CSV file, you can use the to_csv method. The to_csv method takes a few optional arguments that you can use to customize the output. For example, you can use the “sep” argument to specify a different delimiter to use in the CSV file or the “index” argument for including or excluding the DataFrame’s index in the output.
Here’s an example of how you can use the to_csv method with the index parameter set to False:
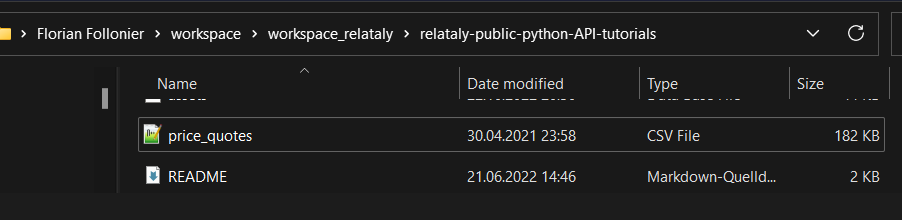
# Save the data to a CSV file
df.to_csv("price_quotes.csv", index=False)
Now you have the data on your local machine and can load it later. So unless you require more actual data, there is no need to call the API again.
Summary
This article has shown how to use the Pandas DataReader library. We learned how to use the library to request data from the Yahoo Finance API and save the data to a Pandas DataFrame. The Pandas DataReader library is a helpful tool for importing financial data into a Pandas DataFrame and working with it in Python. You can use it to retrieve data from a wide range of sources, including stock prices from major stock exchanges, economic data from the Federal Reserve, and cryptocurrency prices. Once you have the data in a DataFrame, you can use the various methods and functions provided by Pandas to analyze and manipulate the data, and save the results to a CSV file using the to_csv method.
I hope this post was helpful. If you have any remarks or questions, let me know.

This panda looks happy because it just loaded data into his python project. Image created with Midjourney.
Sources and Further Reading
pandas-datareader.readthedocs.io/
Images created with Midjourney AI