Unveiling Hidden Patterns in the Cryptocurrency Market with Affinity Propagation and Python

Affinity propagation is a powerful unsupervised clustering technique that can identify hidden patterns in large datasets. In the cryptocurrency world, where new coins are constantly emerging and prices can be highly volatile, affinity propagation can help investors simplify the chaos.
By analyzing historical price data, affinity propagation groups coins into clusters based on their past price fluctuations. Such a cluster analysis enables crypto investors to identify promising entry and exit points, ultimately helping them make smarter investment decisions.
To use this technique effectively, it’s important to understand essential concepts such as covariance, lasso regression, and affinity propagation. Once you understand these concepts, you can apply them to analyze price time series data and identify hidden patterns.
Finally, visualizing the results in two and three dimensions can better understand the relationships between coins and their respective clusters. The resulting crypto market map can be a powerful tool for investors to gain insight into the market’s structure and make informed investment decisions.
Disclaimer
This article does not constitute financial advice. Stock markets can be very volatile and are generally difficult to predict. Predictive models and other forms of analytics applied in this article only serve the purpose of illustrating machine learning use cases.
What is Stock Market Clustering?
Clustering stock markets refers to grouping stocks based on their similarities or common characteristics. This can be done using various clustering algorithms, which analyze the data and assign each stock market to a cluster based on its similarity to other stock markets in the same cluster. In this article, we will run a cluster analysis on historical time series data. This approach involves grouping stocks into clusters based on their historical performance over a certain period of time.
Clustering stock market data can be useful for a variety of purposes, such as identifying patterns or trends in the data, comparing the performance of different stocks or sectors, or generating investment recommendations. However, it’s important to keep in mind that clustering is just one tool among many for analyzing stock market data, and it’s important to consider a range of factors when making investment decisions. It can also be used to compare the performance of different stock markets and identify potential risks or correlations between them.
Also: Color-Coded Cryptocurrency Price Charts in Python

We can use a crypto market map to illustrate the price correlation between cryptocurrencies.
What’s the Problem with Prototype-based Clustering?
Clustering is an unsupervised learning technique that groups similar objects into clusters and separates them from different ones. One of the most popular clustering techniques is k-means. K-means belongs to the so-called prototype-based clustering techniques, which divide data points into a predefined number of groups (in the case of k-means, the groups are of equal variance).
The prototype-based clustering approach works great if the number of clusters in a dataset is known and the clusters have similar despair. However, when we deal with real-world problems, we often encounter more complex data for which the optimal number of clusters is unknown and difficult or even impossible to guess. In such a case, affinity propagation has a significant advantage because it can automatically estimate the number of clusters.
Affinity Propagation: What it is and How it Works
The idea of affinity propagation is to identify clusters by measuring the similarity of data points relative to one another. The algorithm chooses data points as cluster centers that best represent other data points near them.
We can imagine the process of identifying these representative data points as an election. Each data point (i) is a voter who casts votes and a candidate (k) who can receive votes from other voters. Votes are a measure of the similarity of data points. A voter who gives many votes to a candidate expresses that this data point is similar to him and therefore is suitable for representing him as a cluster center. The voting process continues until the algorithm reaches a consensus and selects a set number of cluster candidates.
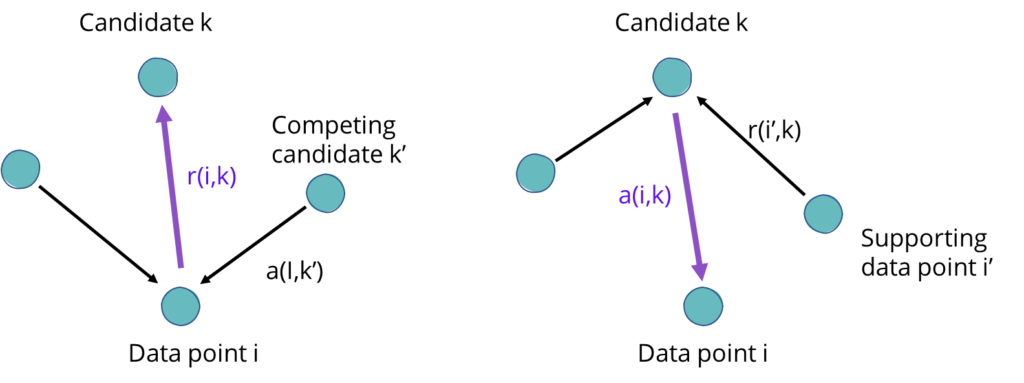
Affinity Propagation: Data points cast votes for candidates and receive votes from other data points
The clustering process involves many separate steps (This article provides a detailed description of the steps involved) and works with several matrices:
- The similarity matrix assesses the suitability of data points (candidates) to act as cluster centers.
- The availability matrix (or responsibility matrix) collects the support of the data points for the candidates (potential cluster centers) and their suitability to represent them.
- The criterion matrix sums up the results and defines the clusters. Data points with equal scores in the criterion matrix are considered part of the same cluster.
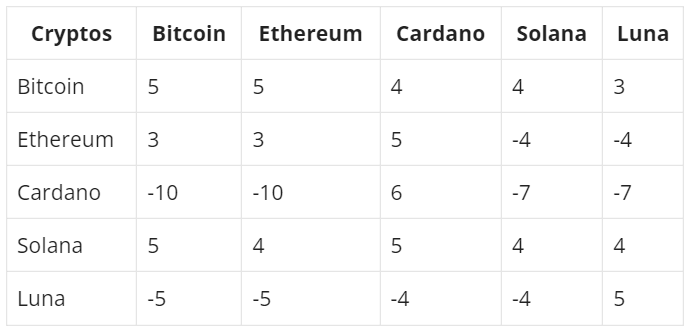
Criterion Matrix: Data Points (Cryptos) with equal numbers are part of the same cluster
Time Series Clustering using Affinity Propagation - Visualizing Cryptocurrency Market Structures in Python
Ready to implement affinity propagation in Python to analyze the crypto market structure and create a visual representation of price similarity? Let’s dive in!
First, we define a portfolio of cryptocurrencies and download their historical price quotes from coinmarketcap. We then visualize the time series on separate line charts to ensure that the data has been loaded successfully. After preparing and cleaning the data, we can move on to clustering the cryptocurrencies into groups with similar price movements using Affinity Propagation.
Unlike other clustering algorithms, we don’t set the number of clusters in advance. Instead, we let affinity propagation determine the optimal number of clusters for our portfolio. Finally, we calculate the covariance matrix between clusters and arrange the cryptocurrencies on a 2D map into clusters. We create a network overlay based on covariance to better understand the relationships between different clusters.
With affinity propagation, we can identify hidden patterns in the crypto market and group coins into clusters based on their past price fluctuations. This process allows us to identify promising entry and exit points, ultimately helping us make smarter investment decisions. Plus, the 2D map and network overlay help us visualize the relationships between different clusters and coins.
We can use affinity propagation to cluster financial assets and visualize them on a map.
The Python code for this tutorial is available in the relataly repository on GitHub.
Prerequisites
Before beginning the coding part, ensure that you have set up your Python 3 environment and required packages. Consider Anaconda if you don’t have a Python environment set up yet. To set it up, you can follow the steps in this tutorial. Also, make sure you install all required packages. In this tutorial, we will be working with the following standard packages:
Please also make sure you have the Cmcscaper package installed. We will be using it to download past crypto prices from coinmarketcap.
You can install these packages using console commands:
- pip install
- conda install
(if you are using the anaconda packet manager)
Step #1: Load the Stock Market Data
We start by loading historical crypto price data from Coinmarketcap. To download the data, we use Cmcscraper, a Python library that allows us to collect Coinmarketcap data without signing up for the official API.
The download returns a dataframe with daily price quotes (Close, Open, Avg) for cryptocurrencies between 2016 and today. You can use the dictionary (“symbol_dict”) to control which cryptos you want to include in the data. We limit the data we use in our cluster analysis to the last 50 days. In this way, we let the correlation consider earlier price developments. But it’s up to you to specify a different period. In addition, instead of using absolute price values, we will use daily percentage fluctuations.
Also: Requesting Crypto Price Data from the Gate.io REST API in Python
Loading the data can take several minutes, depending on how many cryptocurrencies we include in the request. So it makes sense not to load the data every time you run the code. Therefore, the code below stores the historical prices in a CSV file.
The script will check if the data already exists if you run the code below. If it does, it will use the data from the CSV file. Otherwise, it will load a fresh copy of the data from coinmarketcap.
# A tutorial for this file is available at www.relataly.com
# Tested with Python 3.8.8, Matplotlib 3.5, Scikit-learn 0.24.1, Seaborn 0.11.1, numpy 1.19.5

from cryptocmd import CmcScraper
import pandas as pd
import matplotlib.pyplot as plt
import numpy as np
import seaborn as sns
from sklearn import cluster, covariance, manifold
import requests
import json

#get a dictionary of the top 100 coin symbols and names from an API
def get_symbol_dict():
    url = 'https://api.coinmarketcap.com/data-api/v3/cryptocurrency/listing?start=1&limit=50&sortBy=market_cap&sortType=desc&convert=USD&cryptoType=all&tagType=all&audited=false'
    response = requests.get(url)
    data = json.loads(response.text)
    df = pd.DataFrame(data['data']['cryptoCurrencyList'])

    # exclude stable coins
    df = df[~df['symbol'].isin(['USDT', 'USDC', 'BUSD', 'DAI', 'TUSD', 'PAX', 'GUSD', 'HUSD', 'USDK', 'USDS', 'USDP', 'USDN', 'USDSB', 'USDX', 'USD++', 'BIDR', 'IDRT', 'VAI', 'BGBP'])]
    df = df[['symbol', 'name']]
    df = df.set_index('symbol')
    df = df.to_dict()
    df = df['name']
    return df

symbol_dict = get_symbol_dict()

# Download historic crypto prices via CmcScraper
def load_fresh_data_and_save_to_disc(symbol_dict, save_path):
    # Extract symbols and names from the symbol_dict
    symbols, names = np.array(sorted(symbol_dict.items())).T

    # Initialize an empty DataFrame for storing the prices
    df_crypto = pd.DataFrame()

    # Download and process the price data for each symbol
    for symbol in symbols:
        print(f"Fetching prices for {symbol}...")

        # Download the price data using CmcScraper
        scraper = CmcScraper(symbol)
        df_coin_prices = scraper.get_dataframe()

        # Process the price data and add it to df_crypto
        df = pd.DataFrame({
            f"{symbol}_Open": df_coin_prices["Open"],
            f"{symbol}_Close": df_coin_prices["Close"],
            f"{symbol}_Avg": (df_coin_prices["Close"] + df_coin_prices["Open"]) / 2,
            f"{symbol}_p": (df_coin_prices["Open"] - df_coin_prices["Close"]) / df_coin_prices["Open"]
        })
        df_crypto = pd.concat([df_crypto, df], axis=1)

    # Save the price data to a CSV file
    X_df_filtered = df_crypto.filter(like="_p")
    X_df_filtered.to_csv(save_path + "historical_crypto_prices.csv")

    return names, symbols, X_df_filtered

# If set to False the data will only be downloaded when you execute the code
# Set to True, if you want a fresh copy of the data.
fetch_new_data = True
save_path = '' # path where the price data will be stored in a csv file

# Fetch fresh data via the scraping package, or use data from the csv file on disk
if fetch_new_data == False:
    try:
        print('loading from disk')
        X_df_filtered = pd.read_csv(save_path + 'historical_crypto_prices.csv')
        if 'Unnamed: 0' in X_df_filtered.columns:
            X_df_filtered = X_df_filtered.drop(['Unnamed: 0'], axis=1)
            symbols, names = np.array(sorted(symbol_dict.items())).T
        print(list(X_df_filtered.columns))
    except:
        print('no existing price data found - loading fresh data from coinmarketcap and saving them to disk')
        names, symbols, X_df_filtered = load_fresh_data_and_save_to_disc(symbol_dict, save_path)
        print(list(symbols))
else:
       print('loading fresh data from coinmarketcap and saving them to disk')
       names, symbols, X_df_filtered = load_fresh_data_and_save_to_disc(symbol_dict, save_path)
       print(list(symbols))

# Limit the price data to the last t days
t= 14 # in days
X_df_filtered = X_df_filtered[:t]
X_df_filtered.head()
ACM_p ADA_p ARK_p ATM_p ATOM_p AVAX_p BAT_p BCH_p BLZ_p BNB_p ... THETA_p UNI_p USDT_p VET_p WAVES_p XLM_p XMR_p XRP_p ZIL_p ZRX_p
0 0.031987 -0.037645 -0.005702 0.030928 -0.005897 -0.012404 -0.012262 -0.022529 0.008072 -0.007111 ... -0.021994 -0.023758 -0.000103 -0.021024 -0.015416 -0.004096 -0.022988 -0.027397 -0.016659 -0.012255
1 0.028192 0.065034 0.122306 0.010310 0.093558 0.106811 0.082863 0.075567 0.062105 0.054733 ... 0.067264 0.081040 0.000136 0.077203 0.092987 0.078562 0.111519 0.071696 0.076484 0.085094
2 0.040771 0.016097 -0.133345 0.018963 0.011304 -0.033328 -0.007616 0.011458 -0.019993 0.005134 ... -0.005104 -0.024190 0.000077 0.002218 0.008920 0.004139 -0.031822 -0.012107 -0.003906 -0.021170
3 -0.027698 0.005129 -0.031516 -0.002639 0.022235 -0.008117 0.003969 0.019119 0.015403 0.005920 ... 0.007992 0.027203 0.000003 0.000701 0.010739 0.005324 -0.007914 0.007168 0.004556 -0.003786
4 -0.021129 -0.019053 0.003273 -0.008121 0.002883 -0.004927 0.002548 -0.000599 0.028492 -0.012181 ... 0.000198 -0.025817 -0.000047 -0.002800 -0.051515 -0.004861 0.015134 -0.000596 -0.010343 0.004530The data looks good, so let’s continue.
Step #2 Plotting Crypto Price Charts
Now that the data is available, we can visualize it in various line graphs. The visualization helps us better understand what kind of data we are dealing with and check if the download was successful.
# Create Prices Charts for all Cryptocurrencies
list_length = X_df_filtered.shape[1]
ncols = 10
nrows = int(round(list_length / ncols, 0))
height = list_length/3 if list_length > 30 else 4
fig, axs = plt.subplots(nrows=nrows, ncols=ncols, sharex=True, sharey=True, figsize=(20, height))
for i, ax in enumerate(fig.axes):
        if i < list_length:
            sns.lineplot(data=X_df_filtered, x=X_df_filtered.index, y=X_df_filtered.iloc[:, i], ax=ax)
            ax.set_title(X_df_filtered.columns[i])
plt.show()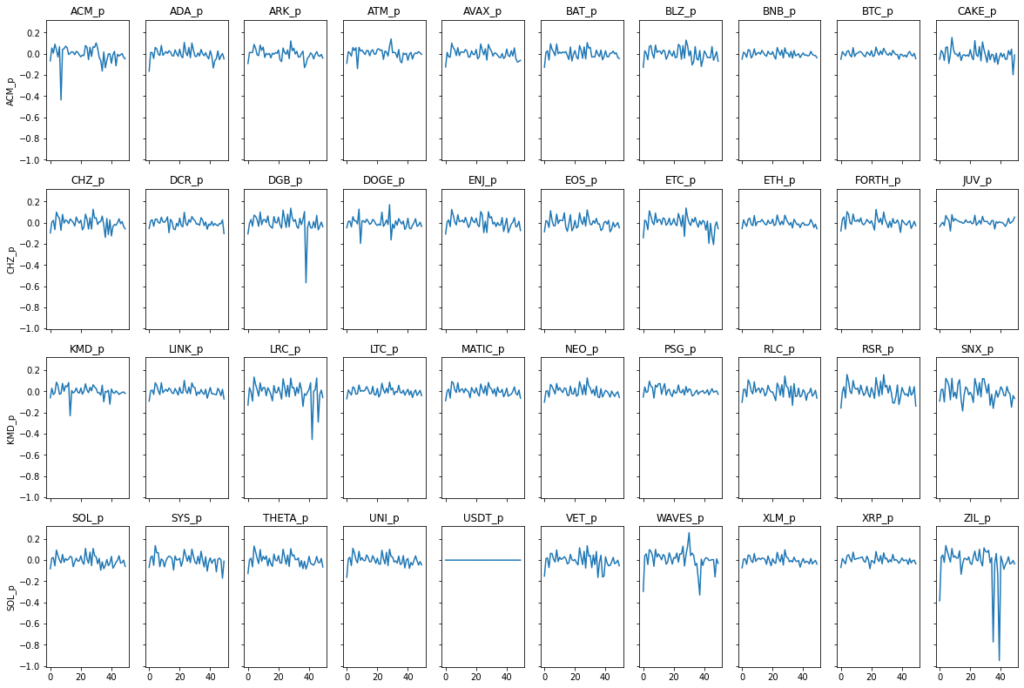
We can see the lineplots for all cryptocurrencies and everything looks as expected.
Step #3 Clustering Cryptocurrencies using Affinity Propagation
Next, we must prepare the data and run the affinity propagation algorithm. For some cryptocurrencies, we may encounter data that contains NaN values. Because clustering is sensitive to missing values, we must ensure good data quality. In addition, the Python code below will convert the DataFrame into a NumPy array and transpose it into a form where we have crypto assets as records and the days as columns.
Running the code below returns a dictionary of clusters with the cryptocurrencies assigned to them by the affinity propagation algorithm.
# Drop NaN values
X_df = pd.DataFrame(np.array(X_df_filtered)).dropna()
# Transpose the data to structure prices along columns
X = X_df.copy()
X /= X.std(axis=0)
X = np.array(X)
# Define an edge model based on covariance
edge_model = covariance.GraphicalLassoCV()
# Standardize the time series
edge_model.fit(X)
# Group cryptos to clusters using affinity propagation
# The number of clusters will be determined by the algorithm
cluster_centers_indices , labels = cluster.affinity_propagation(edge_model.covariance_, random_state=1)
cluster_dict = {}
n_labels = labels.max()
print(f"{n_labels} Clusters")
for i in range(n_labels + 1):
    clusters = ', '.join(names[labels == i])
    print('Cluster %i: %s' % ((i + 1), clusters))
    cluster_dict[i] = (clusters)
9 Clusters
Cluster 1: Binance Coin, Cake Defi
Cluster 2: Bitcoin Cash, Bitcoin, BitTorrent, Decred, EOS, Ethereum Classic, Ethereum, Ampleforth, Komodo, Solana, Sys Coin, DOT
Cluster 3: Celsius
Cluster 4: Doge Coin
Cluster 5: Cardano, ATOM, Avalance, Enjin, Internet Computer, Link, Loopring, Polygon, IOTA, NEO, Synthetix, Theta, Vechain
Cluster 6: Litecoin
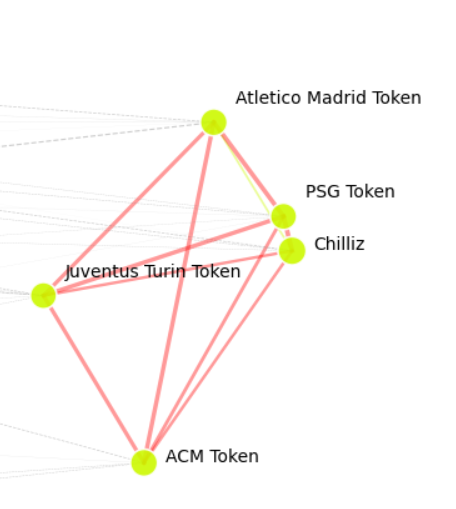
Cluster 7: ACM Token, Atletico Madrid Token, Chilliz, Juventus Turin Token, PSG Token
Cluster 8: LRC
Cluster 9: Tether
Cluster 10: ARK, Battoken, BLZ, Digibyte, AS Rom Token, WAVES, Stellar Lumen, Monero, Ripple, Zilliqa, Zer0We can see that the algorithm has identified 13 different clusters in the data and a couple of clusters with only a single member. You will most likely encounter different results depending on when you run it.
Step #4 Create a 2D Positioning Model based on the Graph Structure
In addition to clusters, we want to show the covariance between cryptocurrencies in our Crypto Market map. We need a graph-like structure that contains the covariance and position data of the cryptocurrencies for each crypto pair.
In addition, we use a node position model that calculates their relative position on a 2D plane from the covariance of the cryptocurrencies. However, the positions are only relative, so the absolute axes have no meaning.
# Create a node_position_model that find the best position of the cryptos on a 2D plane
# The number of components defines the dimensions in which the nodes will be positioned
node_position_model = manifold.LocallyLinearEmbedding(n_components=2, eigen_solver='dense', n_neighbors=20)
embedding = node_position_model.fit_transform(X.T).T
# The result are x and y coordindates for all cryptocurrencies
pd.DataFrame(embedding)
# Create an edge_model that represents the partial correlations between the nodes
partial_correlations = edge_model.precision_.copy()
d = 1 / np.sqrt(np.diag(partial_correlations))
partial_correlations *= d
partial_correlations *= d[:, np.newaxis]
# Only consider partial correlations above a specific threshold (0.02)
non_zero = (np.abs(np.triu(partial_correlations, k=1)) > 0.02)
# Convert the Positioning Model into a DataFrame
data = pd.DataFrame.from_dict({"embedding_x":embedding[0],"embedding_y":embedding[1]})
# Add the labels to the 2D positioning model
data["labels"] = labels
print(data.shape)
data.head()
(48, 3)
embedding_x embedding_y labels
0 0.400590 -0.136473 6
1 -0.081908 -0.086039 4
2 -0.033982 -0.038526 9
3 0.416745 0.076849 6
4 -0.041938 0.031966 4The next step is to create a graph of the partial correlations.
Step #5 Visualize the Crypto Market Structure
Our goal is to visualize differences in the covariance between crypto pairs by varying the connection strengths. We calculate the line strength by normalizing the covariance of the crypto pairs. In addition, we visualize the distribution of the covariance.
# Create an array with the segments for connecting the data points
start_idx, end_idx = np.where(non_zero)
segments = [[np.array([embedding[:, start], embedding[:, stop]]).T, start, stop] for start, stop in zip(start_idx, end_idx)]
# Create a normalized representation of partial correlation between crypto currencies
# We can later use covariance to vizualize the strength of the connections
pc = np.abs(partial_correlations[non_zero])
normalized = (pc-min(pc))/(max(pc)-min(pc))
# plot the distribution of covariance between the cryptocurrencies
sns.histplot(pc)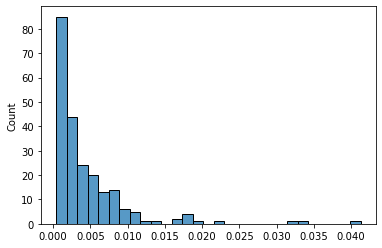
The hist plot shows that the covariance between the crypto pairs is mostly below 0.005.
Finally, it is time to map cryptocurrencies on a 2D plane. To do this, we first define the cryptocurrencies using their relative position data with a scatterplot. We set the color of the points based on their clusters so that points in the same cluster are colored the same. Subsequently, we connect the points to the data from the edge model. The covariance between the crypto pairs determines the strength of their connections.
We also define the color of the connections as follows.
- The map only shows connections with a covariance greater than 0.002.
- Connections with a covariance greater than 0.05 are colored red.
- Otherwise, connections between points within a cluster are shown in the cluster’s color.
- We color connections in grey that are between points of different clusters.
Last but not least, we add the labels of the cryptocurrencies.
# Visualization
plt.figure(1, facecolor='w', figsize=(20, 8))
plt.clf()
ax = plt.axes([0., 0., 1., 1.])

# Plot the nodes using the coordinates of our embedding
sc = sns.scatterplot(
    data=data,
    x="embedding_x",
    y="embedding_y",
    zorder=1,
    s=350 * d ** 2,
    c=labels,
    cmap=plt.cm.nipy_spectral,
    alpha=.9,
    #palette="muted",
)

# Plot the covariance edges between the nodes (scatter points)
line_strength = 3.2

for index, ((x, y), start, stop) in enumerate(segments):
    norm_partial_correlation = normalized[index]
    if list(data.iloc[[start]]['labels'])[0] == list(data.iloc[[stop]]['labels'])[0]:
        if norm_partial_correlation > 0.5:
            color = 'red'; linestyle='solid'
        else:
            color = plt.cm.nipy_spectral(list(data.iloc[[start]]['labels'])[0] / float(n_labels)); linestyle='solid'
    else:
        if norm_partial_correlation > 0.5:
            color = 'red'; linestyle='solid'
        else:
            color = 'grey'; linestyle='dashed'
    # Plot the edges
    # if x and y larger than 0
    if x[0] > 0 and y[0] > 0:
        plt.plot(x, y, alpha=.4, zorder=0, linewidth=normalized[index]*line_strength, color=color, linestyle=linestyle)

# Labels the nodes and position the labels to avoid overlap with other labels
for name, label, (x, y) in zip(names, labels, embedding.T):
    color = plt.cm.nipy_spectral(label / float(n_labels))
    ax.annotate(
        name,
        xy=(x, y),
        xytext=(5, 2),
        textcoords='offset points',
        ha='right',
        va='bottom',
        fontsize=10,
        color='black',
        bbox=dict(facecolor='w', edgecolor="w", alpha=.0),
     )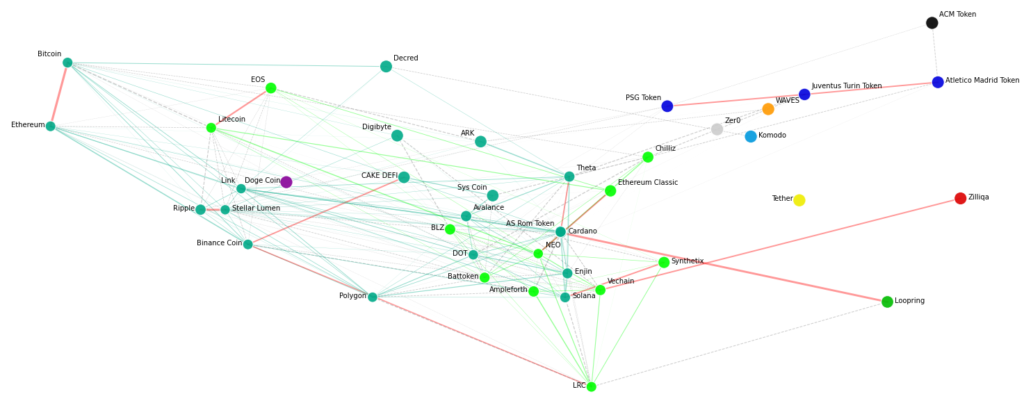
Note that you will likely see a different map when you run the code on your machine. Differences result from changes in market prices and covariance that lead to other graph structures.
Let’s see what the crypto market map tells us.
Interpreting the Cryptomarket Map
The 2D crypto market map tells us several things:
- Most cryptos fall into the light green and dark green clusters corresponding to different types of crypto (Decentralized Finance Coins, NFT/Metaverse Coins).
- There is a significant covariance between large-cap players in the crypto space, such as Cardano and Loopring and Ethereum and Bitcoin, which is plausible considering recent price movements. Some results are surprising, for example, the partial correlation between NEO and Ethereum Classic.
- Some clusters are isolated and contain only a single member, for example, Tether, Komodo, AC Milan token, Wave token, and Dogecoin). The reason is that the prices of these coins/tokens have developed independently of the market.
- Tether is a stablecoin that does not change in price. It, therefore, strongly differs from the other cryptocurrencies on our map.
- Komodo has been trading sideways without following the general market trend.
- And the MCM token is a soccer token that has recently outperformed the market.
- Soccer tokens are colored in dark blue. These tokens’ prices correlate with how the soccer clubs performed during the current season. It, therefore, makes perfect sense that these tokens are grouped into a cluster. An exception is the AC Milan token, which recently performed better than the other soccer tokens.
Step #6 Creating a 3D Representation
Instead of a 2D representation of the data points, we can also use a 3D node positioning model. For this purpose, the node positioning model distributes the affinity values over three dimensions.
# Find the best position of the cryptos on a 3D plane
node_position_model = manifold.LocallyLinearEmbedding(n_components=3, eigen_solver='dense', n_neighbors=20)
embedding = node_position_model.fit_transform(X.T).T
# The result are x and y coordindates for all cryptocurrencies
pd.DataFrame(embedding)
# Display a graph of the partial correlations
partial_correlations = edge_model.precision_.copy()
d = 1 / np.sqrt(np.diag(partial_correlations))
partial_correlations *= d
partial_correlations *= d[:, np.newaxis]
non_zero = (np.abs(np.triu(partial_correlations, k=1)) > 0.02)
data = pd.DataFrame.from_dict({"embedding_x":embedding[0],"embedding_y":embedding[1],"embedding_z":embedding[1]})
data["labels"] = labels
data["names"] = names
import matplotlib.pyplot as plt
import numpy as np
fig = plt.figure(figsize=(20,20))
ax = fig.add_subplot(projection='3d')
xs = data["embedding_x"]
ys = data["embedding_y"]
zs = data["embedding_z"]
sc = ax.scatter(xs, ys, zs, c=labels, s=100)

for i in range(len(data)):
    x = xs[i]
    y = ys[i]
    z = zs[i]
    label = data["names"][i]
    ax.text(x, y, z, label)

plt.legend(*sc.legend_elements(), bbox_to_anchor=(1.05, 1), loc=2)
plt.show()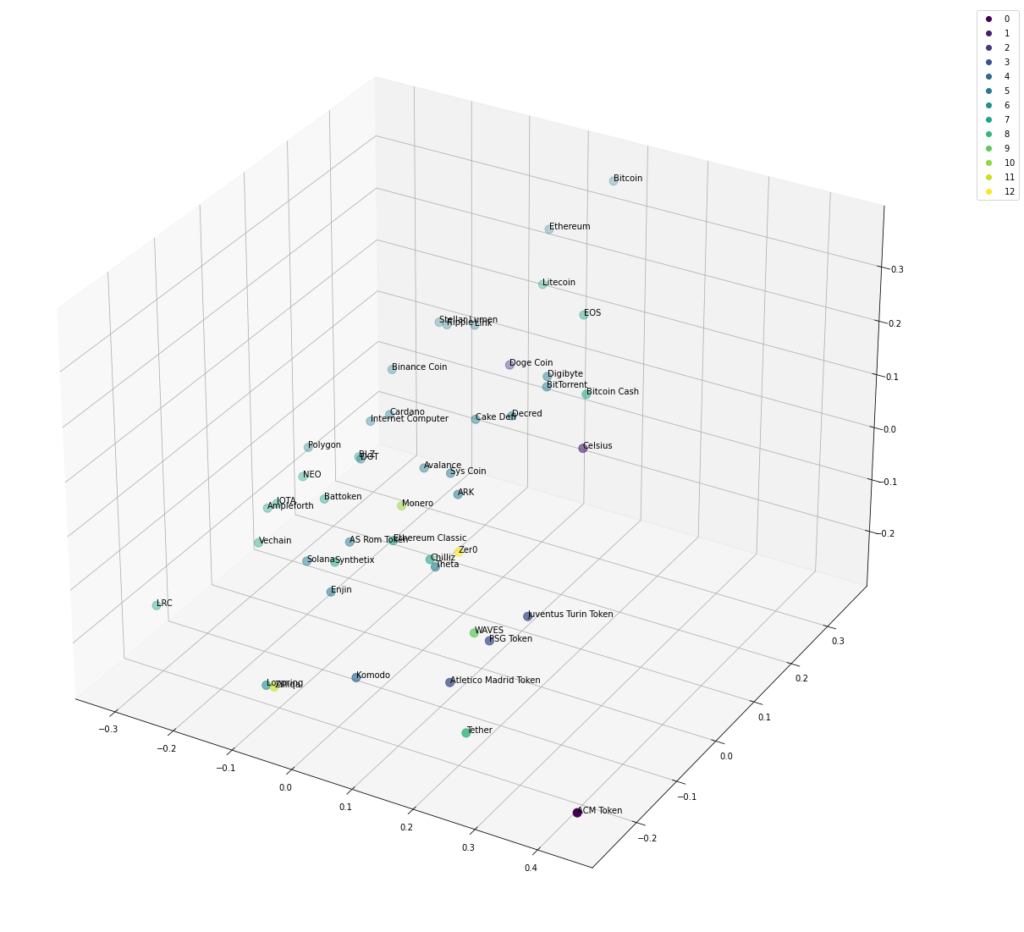
Summary
Affinity propagation is a powerful technique for clustering items when the optimal number of clusters is unknown. In this article, we’ve demonstrated how to apply affinity propagation to analyze the cryptocurrency market and identify groups of assets based on similar price fluctuations.
In our example, we identified 13 groups of cryptocurrencies without specifying the number of clusters in advance. We also visualized the market structure on a 2D and 3D map using a node distribution technique. This approach can be extended to analyze and cluster stock markets, highlighting complex price patterns among multiple financial assets.
Once you’ve identified clusters, you can dive deeper into individual groups. Sometimes, outliers that temporarily break out of their usual pattern indicate interesting investment opportunities. These outliers can eventually return to the price pattern of their group, or they may represent forerunners of their group, indicating broader market movements.
By using affinity propagation, we can visualize financial assets in a new and exciting way. If you have any questions or comments about this approach, please let me know.
Sources and Further Reading
This article modifies some of the code from Scikit-learn and adapts it from the stock market to cryptocurrencies.
- Jansen (2020) Machine Learning for Algorithmic Trading: Predictive models to extract signals from market and alternative data for systematic trading strategies with Python
- Aurélien Géron (2019) Hands-On Machine Learning with Scikit-Learn, Keras, and TensorFlow: Concepts, Tools, and Techniques to Build Intelligent Systems
- David Forsyth (2019) Applied Machine Learning Springer
- Andriy Burkov (2020) Machine Learning Engineering
- Images are created using Midjourney, an AI that creates images from text.
The links above to Amazon are affiliate links. By buying through these links, you support the Relataly.com blog and help to cover the hosting costs. Using the links does not affect the price.


1 Commentarchived from the original site