On-Chain Analytics: Metrics for Analyzing Blockchains in Python

Cryptocurrencies like Bitcoin or Ethereum are built on public blockchains, meaning anyone can see the transactions and trades happening on these networks. This transparency makes on-chain data an excellent resource for data science and machine learning. By examining transaction activity and the holdings of Bitcoin addresses, analysts can better understand a cryptocurrency network’s health and growth. For instance, tracking the volume of transactions can give insight into network growth. On-chain analysis can be particularly helpful for investors and network participants because they often have difficulty accurately assessing the value of cryptocurrencies due to hype and speculation. In this article, we’ll show you how to use Python to analyze on-chain data. To make things easier, we’ll be accessing aggregated on-chain data from the CryptoCompare API instead of using raw blockchain data.
This article consists of two parts: The first part briefly discusses blockchain technology and how it relates to on-chain analysis. This is followed by a hands-on Python tutorial. In the tutorial, we will retrieve different types of blockchain data and analyze Bitcoin and Ethereum, exploring various aspects of blockchain technology, such as price correlatedness, network growth and usage, and network health. Specifically, we will examine seven key metrics useful for analyzing blockchain data. We will be using the CryptoCompare API as our data source, which provides access to various on-chain and off-chain data.
Disclaimer: This article does not constitute financial advice. Stock markets can be very volatile and are generally difficult to predict. Predictive models and other forms of analytics applied in this article only illustrate machine learning use cases.
What is OnChain Analysis?
Before discussing on-chain analysis, let’s start to recap what blockchain is. The blockchain is a decentralized distributed ledger that records transactions across a network of computers. The blockchain is composed of blocks. Each block contains a record of multiple transactions. Blocks are linked to one another, forming a chain of blocks, hence the name “blockchain.”. The blockchain is created by securely linking the blocks using cryptography, making them immutable. Each block added to the blockchain contains a cryptographic hash of the previous block, timestamp, and transaction data. In the case of Bitcoin, the data stored in the blocks include the transaction amount, the timestamp, and the unique addresses of the sender and the recipient.
Once a block has been added to the blockchain, changing the information is extremely difficult or even impossible. Moreover, unlike a normal database, the blockchain does not store its information in one place but decentrally at several participants in the network. This basic idea of decentral exchange and storage of transactions has inspired a wave of new business models and financial services that were not possible before.

neural network machine learning python affinity propagation midjourney relataly crypto-min
On-Chain Data
On-chain data refers to data that is stored on the blockchain. It includes information such as the transaction history of a particular cryptocurrency, the balances of cryptocurrency addresses, and the smart contract code and execution history on a blockchain network. This data is stored on the blockchain and is publicly accessible to anyone with an internet connection. We can broadly classify this data into three distinct categories:
- Transaction data (e.g., sending and receiving address, transferred amount, remaining value for a certain address)
- Block data (e.g., timestamps, miner fees, rewards)
- Smart contract code (i.e., codified business logic on a Blockchain)
On-chain data is an essential source of information for analysts and researchers because it provides a transparent and immutable record of activity on the blockchain. It can be used to study trends and patterns in cryptocurrency adoption and usage, as well as to track the growth and health of a blockchain network. In addition, analysts may combine on-chain data with data not stored on the blockchain. This so-called off-chain data includes, for example, price information and trading volumes.
The role of Cryptographic Proof Systems
Since the original idea, blockchain technology has evolved, and new blockchains have emerged. Changes relate in particular to the security mechanism that determines how transactions are confirmed in the network. A cryptographic proof system is a method of verifying the authenticity and integrity of data by using cryptographic techniques. Because the specific data that is stored on the blockchain may vary depending on the specific design of the blockchain and its cryptographic proof system. This means, depending on the type of blockchain, we will have different data available for our analysis.

The classic cryptographic proof system is based on mining. However, modern systems such as proof of stake are gaining traction as they use far less energy. Image generated using Midjourney
Proof-of-work vs Proof-of-stake
The two most common consensus algorithms are proof-of-work and proof-of-stake (PoS). In the case of Bitcoin, security is guaranteed by means of the proof-of-work (PoW) procedure. In this process, so-called miners continuously spend computing power to solve cryptographic puzzles in competition with each other. The winner gets to sign a block and receives a reward for their efforts. The complexity of the puzzles is called the mining difficulty. While the mining dynamically adapts to the network’s available computing power (hash rate) and generally increases, the rewards are reduced every couple of years in a bitcoin halving event. In a PoW system, the data that is stored on the blockchain typically includes the transaction history of a particular cryptocurrency, the balances of cryptocurrency addresses, and the smart contract code and execution history on a blockchain network.
Proof of stake is an alternative to proof of work. The algorithm is designed to be more energy efficient than proof of work, as it does not require miners to perform computationally intensive work in order to create new blocks. The creator of a new block is chosen deterministically, depending on their stake in the cryptocurrency. This means that the more cryptocurrency a specific miner holds, the more likely the algorithm will enable them to create a new block. In a proof-of-stake (PoS) system, the data stored on the blockchain may include similar information, such as the transaction history and balances of cryptocurrency addresses, as well as information about the stake that is being used to secure the network.
Other types of cryptographic proof systems, such as proof-of-authority (PoA) and proof-of-elapsed-time (PoET), may store similar but not identical types of data on the blockchain.
Analyzing Blockchain Data for Bitcoin and Ethereum with Python
In this tutorial, we will explore how we can use on-chain data to gain insights into the historical development and adoption of Bitcoin and Ethereum, the two most well-known cryptocurrencies. Our analysis will focus on the adoption of the Bitcoin and Ethereum blockchains, network security, and health. By analyzing a range of data types, we can uncover interesting insights about the growth and usage of these blockchain networks. On-chain analysts use a variety of metrics to try to improve their understanding of a network and predict future price movements. The specific metrics we will be examining are:
- Metric #1 Correlation with Bitcoin Price
- Metric #2 Distribution by Holder Amount
- Metric #3 Difficulty vs. Hashrate
- Metric #4 Difficulty vs. Price
- Metric #5 Active Addresses compared to Bitcoin
- Metric #6 Transaction Count compared to Bitcoin
- Metric #7 Large Transactions compared to Bitcoin
As always, you can find the code of this tutorial on the GitHub repository.
Analyzing Blockchain Data for Bitcoin and Ethereum with Python. Image generated using DALL-E 2 by OpenAI.
Prerequisites
Before you proceed, ensure that you have set up your Python environment (3.8 or higher) and the required packages. If you don’t have an environment, follow this tutorial to set up the Anaconda environment. Also, make sure you install all required packages. In this tutorial, we will be working with the following standard packages:
You can install packages using console commands:
pip install <package name>
conda install <package name> (if you are using the anaconda packet manager)
Obtain a CryptoCompare API Key
Accessing the CryptoCompare API requires an API key. Fortunately, there is a free tier that offers generous limits and a wide range of available data. In addition, the API has excellent documentation and offers an interactive API request builder.
You can obtain your free API Key from the CryptoCompare website by clicking “Get Your Free Key” and following the registration steps. Once you have completed the registration, you must provide your API key in any request sent to the API endpoints.
It’s a best practice not to store the key directly into your code and instead import and access the API key from a separate YAML file. Store your API key in a YAML file called “api_config_cryptocompare.yml” as follows:
api_key: “your cryptocompare api key”
Place the file into a folder from where you can import it into your Python project, e.g., “workspace/API Keys/”
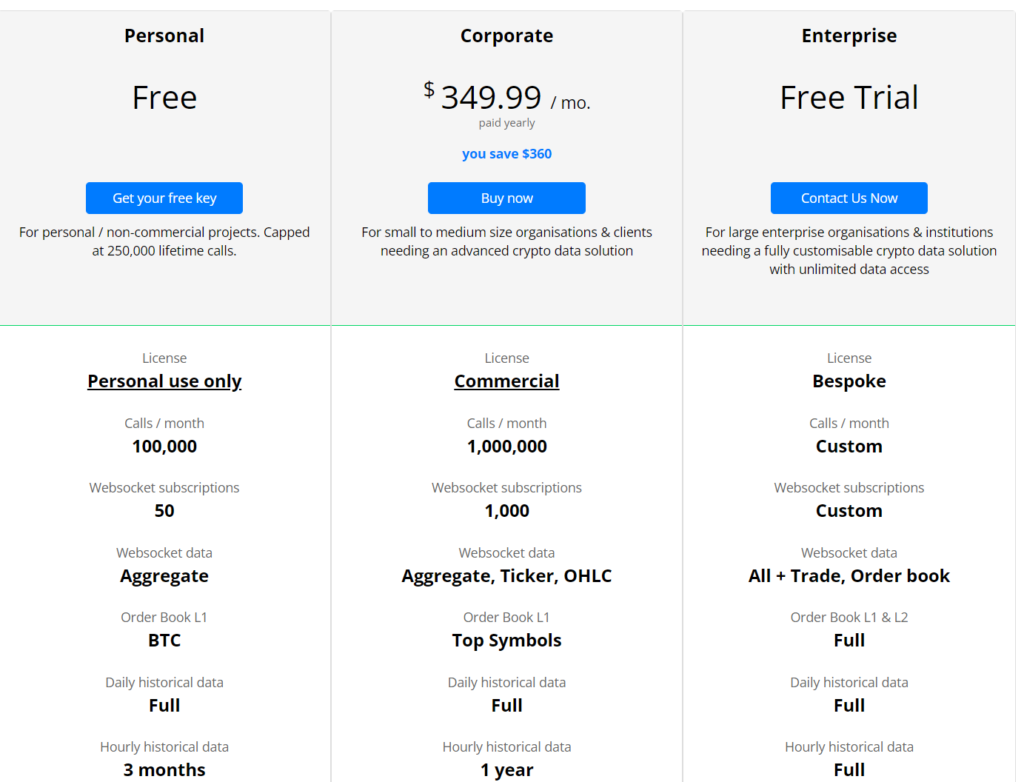
If you use CryptoCompare for personal purposes, you can register for a free API key
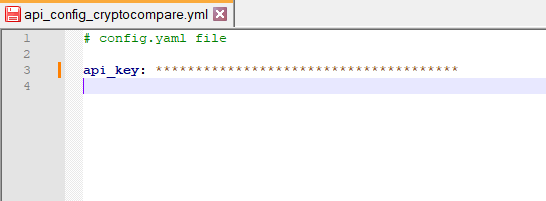
api_config_cryptocompare.yml
Loading Packages and API Key
Let’s begin by loading the required packages and our CryptoCompare API key. The code below will load the API key from a YAML file. Should you prefer to set your key directly from the code, comment lines 18-20 and replace the “YOUR_API_KEY” with your actual API key. Make sure to keep your API key secret and secure, as it allows you to access data from the CryptoCompare API.
Note that the variables symbol_a and symbol_b define which cryptocurrencies are in the scope of the analysis. symbol_a needs to be Bitcoin because of the way how the code works. The following code sample will run the analysis for Ethereum and compare it against Bitcoin. But if you want to run the analysis for another cryptocurrency, you can change symbol_b. The prerequisite is that CryptoCompare has the respective data.
# A tutorial for this file will soon be available at www.relataly.com

# Tested with Python 3.9.13, Matplotlib 3.5.2, Seaborn 0.11.2, numpy 1.21.5, plotly 4.1.1, cryptocompare 0.7.6

import pandas as pd
import matplotlib.pyplot as plt
import numpy as np
from datetime import date, timedelta, datetime
import seaborn as sns
sns.set_style('white', {'axes.spines.right': True, 'axes.spines.top': False})
import cryptocompare as cc
import requests
import IPython
import yaml
import json

# Set the API Key from a yaml file
yaml_file = open('API Keys/api_config_cryptocompare.yml', 'r')
p = yaml.load(yaml_file, Loader=yaml.FullLoader)
api_key = p['api_key']
# alternatively if you have not stored your API key in a separate file
# api_key = YOUR_API_KEY

# Number of past days for which we retrieve data
data_limit = 2000

# Define coin symbols
symbol_a = 'BTC'
symbol_b = 'ETH'
We proceed by querying the CryptoCompare API to load the data for our analysis. Our data comes from three separate API endpoints:
- Historical prices for Bitcoin and Ethereum
- Onchain data for Bitcoin and Ethereum
- Bitcoin address distribution data for Bitcoin
Loading Price Data
First, we will load the price data from the cryptocompare histoday-API endpoint. This API provides us with a JSON response with a timestamp and daily prices and volume. The code below also converts the JSON response into a Pandas dataframe.
# Query price data

# Generic function for an API call to a given URL
def api_call(url):
  # Set API Key as Header
  headers = {'authorization': 'Apikey ' + api_key,}
  session = requests.Session()
  session.headers.update(headers)

  # API call to cryptocompare
  response = session.get(url)

  # Conversion of the response to dataframe
  historic_blockdata_dict = json.loads(response.text)
  df = pd.DataFrame.from_dict(historic_blockdata_dict.get('Data').get('Data'), orient='columns', dtype=None, columns=None)
  return df

def prepare_pricedata(df):
  df['date'] = pd.to_datetime(df['time'], unit='s')
  df.drop(columns=['time', 'conversionType', 'conversionSymbol'], inplace=True)
  return df

# Load the price data
base_url = 'https://min-api.cryptocompare.com/data/v2/histoday?fsym='
df_a = api_call(f'{base_url}{symbol_a}&tsym=USD&limit={data_limit}')
coin_a_price_df = prepare_pricedata(df_a)
df_b = api_call(f'{base_url}{symbol_b}&tsym=USD&limit={data_limit}')
coin_b_price_df = prepare_pricedata(df_b)
coin_b_price_df.head(3)
high low open volumefrom volumeto close date
0 322.28 285.89 315.86 829138.34 2.498194e+08 292.90 2017-06-29
1 305.30 270.43 292.90 715498.52 2.054092e+08 280.68 2017-06-30
2 281.81 253.18 280.68 812033.74 2.141271e+08 261.00 2017-07-01Now that we have the price history for Bitcoin and Ethereum, we can display the data on a line chart. Because it’s such an important event, we will also add the relevant Bitcoin halving dates. The Bitcoin halving is a built-in feature of the Bitcoin protocol that occurs approximately every four years (210,000 blocks). The purpose of the halving is to control the supply of new Bitcoins and ensure that they are released at a predictable rate. The halving reduces the reward for mining new blocks by half, which means that miners receive fewer new Bitcoins for their efforts. This helps to keep the supply of new Bitcoins in check and maintain the value of existing Bitcoins.
# Query on-chain data

# Prepare the onchain dataframe
def prepare_onchain_data(df):
  # replace the timestamp with a data and filter some faulty values
  df['date'] = pd.to_datetime(df['time'], unit='s')
  df.drop(columns='time', inplace=True)
  df = df[df['hashrate'] > 0.0]
  return df

base_url = 'https://min-api.cryptocompare.com/data/blockchain/histo/day?fsym='
onchain_symbol_a_df = api_call(f'{base_url}{symbol_a}&limit={data_limit}')
onchain_symbol_b_df = api_call(f'{base_url}{symbol_b}&limit={data_limit}')

# Filter some faulty values
onchain_symbol_a_df = onchain_symbol_a_df[onchain_symbol_a_df['hashrate'] > 0.0]
onchain_symbol_a_df.head(3)
id symbol time zero_balance_addresses_all_time unique_addresses_all_time new_addresses active_addresses transaction_count transaction_count_all_time large_transaction_count average_transaction_value block_height hashrate difficulty block_time block_size current_supply
0 1182 BTC 1498694400 259466917 277866951 334750 624172 231054 235758173 10173 13.791733 473438 4.216942e+06 7.116972e+11 724.865546 966836 1.641798e+07
1 1182 BTC 1498780800 259827041 278238910 371959 727417 267360 236025533 13985 12.997582 473592 5.447359e+06 7.116972e+11 561.137255 956314 1.641990e+07
2 1182 BTC 1498867200 260153302 278544516 305606 647826 221856 236247389 10484 10.441163 473756 5.816675e+06 7.116972e+11 525.509202 882732 1.642195e+07We can already see that the Ethereum price has been keeping up with bitcoin over the past years. Recently, the correlation has
Now that we have the price data, let’s quickly visualize it to ensure that the price charts look as expected. We will also encapsulate some of the code in helper functions. We will reuse these functions several times throughout the rest of this tutorial. For example, we will add the Bitcoin halving dates and adjust the legend to account for the two assets in the plot.
# Lineplot Helper Functions

# Adding moving averages
rolling_window = 25
coin_a_price_df['close_avg'] = coin_a_price_df['close'].rolling(window=rolling_window).mean()
coin_b_price_df['close_avg'] = coin_b_price_df['close'].rolling(window=rolling_window).mean()

# This function adds bitcoin halving dates as vertical lines
def add_halving_dates(ax, df_x_dates, df_ax1_y):
    halving_dates = ['2009-01-03', '2012-11-28', '2016-07-09', '2020-05-11', '2024-03-12', '2028-06-01']
    dates_list = [datetime.strptime(date, '%Y-%m-%d').date() for date in halving_dates]
    for i, datex in enumerate(dates_list):
        halving_ts = pd.Timestamp(datex)
        x_max = df_x_dates.max() + timedelta(days=365)
        x_min = df_x_dates.min() - timedelta(days=365)
        if (halving_ts < x_max) and (halving_ts > x_min):
            ax.axvline(x=datex, color = 'purple', linewidth=1, linestyle='dashed')
            ax.text(x=datex  + timedelta(days=20), y=df_ax1_y.max()*0.99, s='BTC Halving ' + str(i) + '\n' + str(datex), color = 'purple')

# This function creates a nice legend for twinx plots
def add_twinx_legend(ax1, ax2, x_anchor=1.18, y_anchor=1.0):
    lines_1, labels_1 = ax1.get_legend_handles_labels()
    lines_2, labels_2 = ax2.get_legend_handles_labels()
    ax1.legend(lines_1 + lines_2, labels_1 + labels_2, loc=1, facecolor='white', framealpha=0, bbox_to_anchor=(x_anchor, y_anchor))
    ax2.get_legend().remove()

# Create the lineplot
fig, ax1 = plt.subplots(figsize=(16, 6))
sns.lineplot(data=coin_a_price_df, x='date', y='close', color='cornflowerblue', linewidth=0.5, label=f'{symbol_a} close price', ax=ax1)
sns.lineplot(data=coin_a_price_df, x='date', y='close_avg', color='blue', linestyle='dashed', linewidth=1.0,
    label=f'{symbol_a} {rolling_window}-MA', ax=ax1)
ax1.set_ylabel(f'{symbol_a} Prices')
ax1.set(xlabel=None)
ax2 = ax1.twinx()
sns.lineplot(data=coin_b_price_df, x='date', y='close', color='lightcoral', linewidth=0.5, label=f'{symbol_b} close price', ax=ax2)
sns.lineplot(data=coin_b_price_df, x='date', y='close_avg', color='red', linestyle='dashed', linewidth=1.0,
    label=f'{symbol_b} {rolling_window}-MA', ax=ax2)
ax2.set_ylabel(f'{symbol_b} Prices')
add_twinx_legend(ax1, ax2, 0.98, 0.2)
add_halving_dates(ax1, coin_a_price_df.date, coin_a_price_df.close)
#ax1.set_yscale('log'), ax2.set_yscale('log')
plt.title(f'Prices of {symbol_a} and {symbol_b}')
plt.show()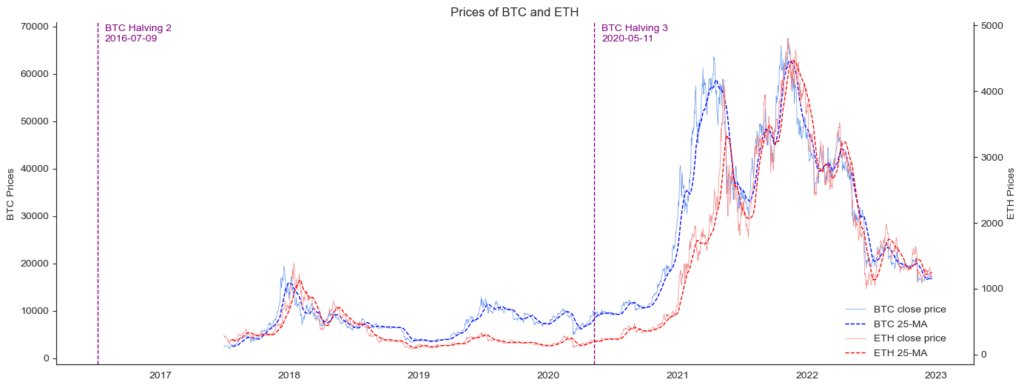
This looks nice and proves that we have brought the data into our project and that it has a useful shape.
Loading On-Chain Data
Next, let’s load the on-chain data. To understand how a blockchain network develops and thrives, we need to look beyond price. To assess network growth, it is important to determine whether the network is being used and can increase the number of its users. Therefore, we include transaction and address data in our analysis.
We make a first API call to “data/blockchain/histo/day” to retrieve a dataset with various blockchain data. The endpoint provides daily on-chain data that includes blockchain key indicators such as:
- The number of addresses in the network
- The number of daily transactions
- Information about the blocks, incl. block size, block height, etc.
- Mining-related information, such as the mining difficulty and the available hash rate
# Prepare the onchain dataframe
def prepare_onchain_data(df):
  # replace the timestamp with a data and filter some faulty values
  df['date'] = pd.to_datetime(df['time'], unit='s')
  df.drop(columns='time', inplace=True)
  df = df[df['hashrate'] > 0.0]
  return df

# Load onchain data for Bitcoin
base_url = 'https://min-api.cryptocompare.com/data/blockchain/histo/day?fsym='
df_a = api_call(f'{base_url}{symbol_a}&limit={data_limit}')
onchain_symbol_a_df = prepare_onchain_data(df_a)

# Load onchain data for Ethereum
df_b = api_call(f'{base_url}{symbol_b}&limit={data_limit}')
onchain_symbol_b_df = prepare_onchain_data(df_b)
onchain_symbol_b_df.head(3)
id symbol zero_balance_addresses_all_time unique_addresses_all_time new_addresses active_addresses transaction_count transaction_count_all_time large_transaction_count average_transaction_value block_height hashrate difficulty block_time block_size current_supply date
0 7605 ETH 20466340 22937123 48698 144688 259915 33294361 11528 44.835955 3950122 56.027705 962749040901496 17.183446 9460 9.289708e+07 2017-06-29
1 7605 ETH 20485843 22984680 47557 145469 249348 33543709 10791 42.018967 3955158 56.652799 972009000387636 17.157299 8800 9.292394e+07 2017-06-30
2 7605 ETH 20498357 23020671 35991 130617 235306 33779015 8715 43.389381 3960167 57.544809 992636469502805 17.249800 8105 9.295062e+07 2017-07-01Another important indicator is how the number of coins in a cryptocurrency is distributed among the stakeholders. Unfortunately, the data required for this is not yet included in our dataset. The following code retrieves the data from a separate API endpoint (data/blockchain/balancedistribution/histo).
# Prepare balance distribution dataframe
def prepare_balancedistribution_data(df):
  df['balance_distribution'] = df['balance_distribution'].apply(lambda x: [i for i in x])
  json_struct = json.loads(df[['time','balance_distribution']].to_json(orient="records"))
  df_ = pd.json_normalize(json_struct)
  df_['date'] = pd.to_datetime(df_['time'], unit='s')
  df_flat = pd.concat([df_.explode('balance_distribution').drop(['balance_distribution'], axis=1),
           df_.explode('balance_distribution')['balance_distribution'].apply(pd.Series)], axis=1)
  df_flat.reset_index(drop=True, inplace=True)
  df_flat['range'] = ['' + str(float(df_flat['from'][x])) + '_to_' + str(float(df_flat['to'][x])) for x in range(df_flat.shape[0])]
  df_flat.drop(columns=['from','to', 'time'], inplace=True)

  # Data cleansing
  df_flat = df_flat[~df_flat['range'].isin(['100000.0_to_0.0'])]
  df_flat['range'].iloc[df_flat['range'] == '1e-08_to_0.001'] = '0.0_to_0.001'
  return df_flat

# Load the balance distribution data for Bitcoin
base_url = 'https://min-api.cryptocompare.com/data/blockchain/balancedistribution/histo/day?fsym='
df_raw = api_call(f'{base_url}{symbol_a}&limit={data_limit}')
df_distr = prepare_balancedistribution_data(df_raw)
df_distr.head(3)
date totalVolume addressesCount range
0 2017-06-29 2068.414842 10651502.0 0.0_to_0.001
1 2017-06-29 12083.780197 3172564.0 0.001_to_0.01
2 2017-06-29 85563.613579 2753955.0 0.01_to_0.1Now, we have all the data that we need and can proceed with our key metrics.
Metric #1 Correlation with Bitcoin Price
The first metric we will be examining is the price correlation with Bitcoin. This is an important metric to consider, as Bitcoin has a dominant position in the cryptocurrency market, and other cryptocurrencies tend to follow its price, sometimes with larger fluctuations. During bull markets, when Bitcoin reaches new highs, other cryptocurrencies tend to see strong price performance. Conversely, during bear markets, when Bitcoin experiences prolonged price declines, most other cryptocurrencies tend to underperform. There are occasional deviations from this pattern, which are usually related to economic or technical changes on the respective networks. The rolling price correlation helps us to understand these types of developments better.
To illustrate how the correlation between the two cryptocurrencies has evolved, we calculate rolling correlations. This means we are applying a correlation between the two time series of Bitcoin and Ethereum as a rolling window calculation. We define 100 days as the window for each calculation.
# Calculate the Rolling Correlation Coefficient
rolling_window = 100 #days

# Generate a work dataframe that includes closing prices and date
df_price_merged = pd.DataFrame.from_dict(data={f'close_{symbol_b}': coin_b_price_df['close'], f'close_{symbol_a}': coin_a_price_df['close'], 'date': coin_a_price_df['date']})
# Create the rolling correlation dataframe
df_temp = pd.DataFrame({'cor': coin_b_price_df.close.rolling(rolling_window).corr(coin_a_price_df.close).dropna()})
# Reverse the index and join the df to create a date index
df_cor_dateindex = df_price_merged.join(df_temp[::-1].set_index(df_temp.index)).dropna().set_index('date')

# Create the plot
fig, ax1 = plt.subplots(figsize=(16, 6))
label = f'{symbol_a}-{symbol_b} correlation (rolling window={rolling_window})'
sns.lineplot(data=df_cor_dateindex, x=df_cor_dateindex.index, y='cor', color='royalblue', linewidth=1.0, label=label)
add_halving_dates(ax1, df_cor_dateindex.index, df_cor_dateindex[f'cor'])
plt.legend(framealpha=0)
plt.title(label)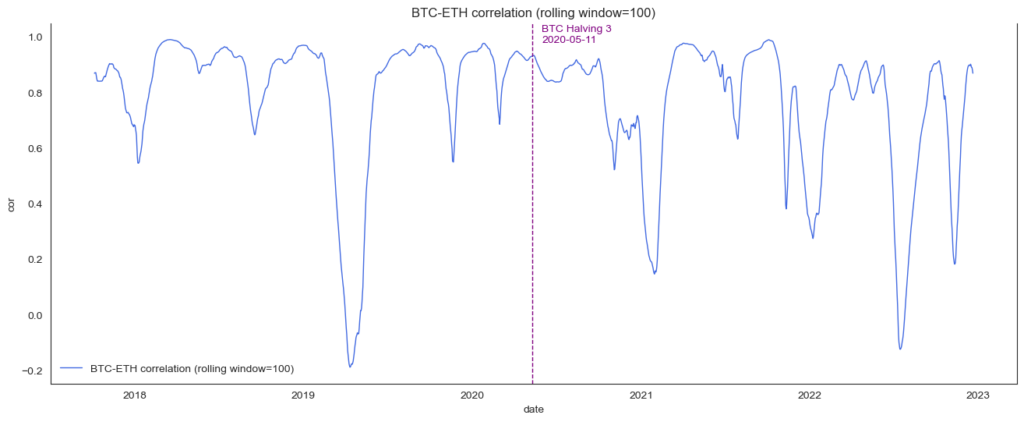
The chart shows that the correlation between Bitcoin and Ethereum has been in the range between 0.95 and -0.2 for quite some time. Currently, both cryptocurrencies are heavily correlated.
Metric #2 Distribution by Holder Amount
Another important aspect to consider is the distribution of coin value among the players in the network. If the majority of coins are concentrated in the hands of a few players, this can pose a risk to the price. This is especially true for proof-of-value networks like Ethereum, where the number of coins owned by players in the network affects their importance to the network. In addition, the distribution of coins can provide insight into price movements. For example, an increase in the number of addresses with a disproportionately large number of coins may be interpreted as a bullish sign, indicating that large players with significant market power are becoming optimistic. On the other hand, a decrease in the number of large addresses may be seen as a bearish sign.
The following code block will display the historical distribution of coins in the Bitcoin network. The data includes the number of addresses in the network that hold a specific amount of Bitcoins, and it distinguishes between different address sizes (e.g., “0.001 - 0.01 BTC”, “0.01 - 0.1 BTC”, and “0.1 - 1 BTC”). We will specifically look at the growth rates in the different holding ranges. A rising line thus means that the growth of th number of addresses in this range accelerates.
# Prepare address distribution data for plotting
df_distr_add = df_distr.copy()
for i in list(df_distr_add.range.unique()):
    df_distr_add.loc[df_distr.range == i, 'addressesCount_pct_cum'] = df_distr_add[df_distr_add.range == i]['addressesCount'].pct_change().dropna().cumsum().rolling(window=50).mean()
df_distr_add.dropna(inplace=True)
# Lineplot: Address Count by Holder Amount
fig, ax1 = plt.subplots(figsize=(16, 6))
sns.lineplot(data=df_distr_add, x='date', hue='range', linewidth = 1.0, y='addressesCount_pct_cum', ax=ax1, palette='bright')
plt.ylabel('Percentage Growth')
ax1.tick_params(axis="x", rotation=90, labelsize=10, length=0)
ax1.set(xlabel=None)
plt.title(f'Percentage Growth in the Distribution of Total Address Count for {symbol_a} by Holder Amount')
plt.legend(framealpha=0)
plt.show()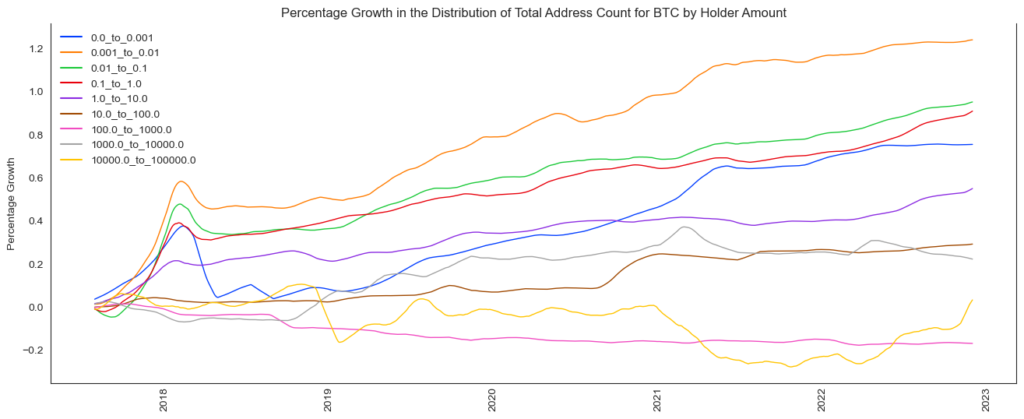
There are a couple of things to denote:
- We can see that the number of large Bitcoin addresses (yellow line) has recently declined (negative growth) but is currently increasing again. This may be a sign that large whales are accumulating Bitcoins again.
- We can also see that the growth rates of smaller addresses are accelerating (orange, green, red, purple lines), which means that the holdings get spread across a wider network.
Metric #3 Difficulty vs. Hashrate
The distribution of coins within a blockchain network is an important factor to consider. The hash rate measures the total computing power available on the network, and a higher hash rate makes it more difficult for attackers to launch a 51% attack, leading to increased network security. The mining difficulty determines how hard it is to mine the next block, and it is measured by the number of hashes that must be generated to find a valid solution.
The difficulty is adjusted periodically to ensure that new blocks are added to the blockchain at a consistent rate. If the hash rate of the network increases significantly, the difficulty will also increase to compensate. This helps to ensure that the rate at which new blocks are added to the blockchain remains constant, regardless of changes in the hash rate.
# Lineplot: Difficulty vs Hashrate
fig, ax1 = plt.subplots(figsize=(16, 6))
sns.lineplot(data=onchain_symbol_a_df, x='date', y='difficulty',
    linewidth=1.0, color='royalblue', ax=ax1, label=f'{symbol_a} mining difficulty')
ax2 = ax1.twinx()
sns.lineplot(data=onchain_symbol_a_df[::5], x='date', y='hashrate',
    linewidth=1.0, color='red', ax=ax2, label=f'{symbol_a} network hashrate')
add_twinx_legend(ax1, ax2, 0.98, 0.2)
add_halving_dates(ax1, onchain_symbol_a_df.date, onchain_symbol_a_df.difficulty)
ax1.set(xlabel=None)
plt.title(f'{symbol_a} Mining Difficulty vs Hashrate')
plt.show()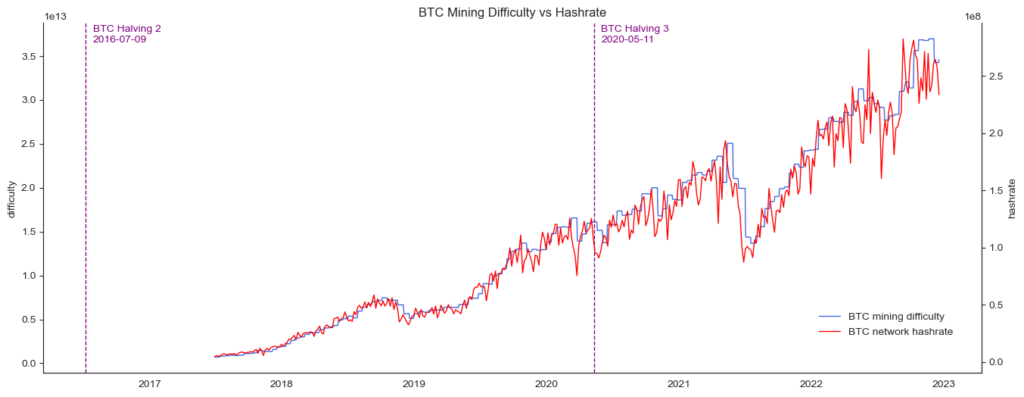
Hash rate and mining difficulty are closely related, which results from the fact that mining difficulty is adjusted periodically. However, it is essential to note that the hash rate does not show the distribution of the computing power in the network. A high hash rate alone does not guarantee network security if it is provided by a small number of parties. To assess the security of a proof-of-work blockchain, we therefore must also look at how the hash rate is distributed.
Metric #4 Difficulty vs. Price
Next, we will compare the difficulty vs. Price. The price of Bitcoin is an essential indicator of the demand for cryptocurrency. When the price is high, it can attract more miners to the network, as they are motivated by the potential to earn a high return on their investment. This can lead to an increase in the overall hash rate of the network, which makes it more secure against attacks. On the other hand, when the price is low, it may discourage miners from joining the network, leading to a decrease in the hash rate and potentially making the network more vulnerable to attacks.
# Add a moving average
rolling_window = 25
coin_a_price_df['close_avg'] = coin_a_price_df['close'].rolling(window=rolling_window).mean()
# Creating a Lineplot: Mining Difficulty vs Price
fig, ax1 = plt.subplots(figsize=(16, 6))
sns.lineplot(data=onchain_symbol_a_df, x='date', y='difficulty', linewidth=1.0, color='orangered', ax=ax1, label=f'mining difficulty')
ax2 = ax1.twinx()
sns.lineplot(data=coin_a_price_df, x='date', y='close', linewidth=0.5, color='skyblue', ax=ax2, label=f'close price')
sns.lineplot(data=coin_a_price_df, x='date', y='close_avg', linewidth=1.0, linestyle='--', color='royalblue', ax=ax2, label=f'MA-100')
add_twinx_legend(ax1, ax2, 0.98, 0.2)
add_halving_dates(ax1, onchain_symbol_a_df.date, onchain_symbol_a_df.hashrate)
ax1.set(xlabel=None)
ax1.set(ylabel='Mining Difficulty')
plt.title(f'{symbol_a} Mining Difficulty vs Price')
plt.show()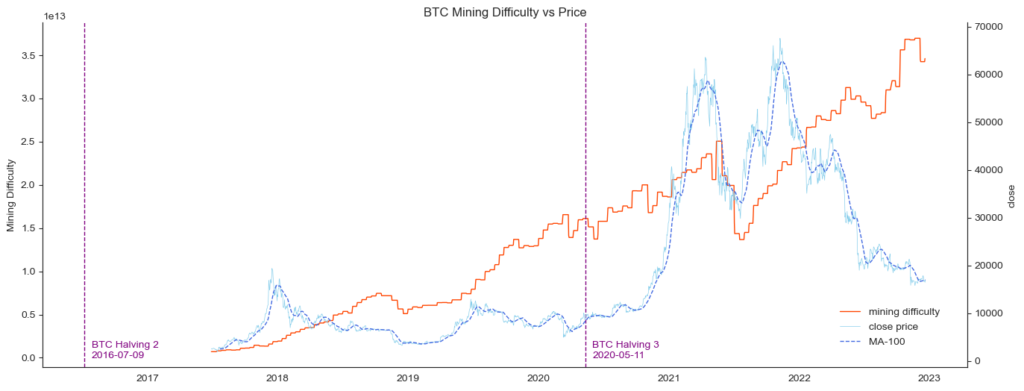
Currently, the price of Bitcoin is low while the mining difficulty is high. As a result, it may be less attractive for miners to join the network. This is because the low price means that the potential reward for mining a new block may not be as high as it could be if the price were higher. At the same time, the high difficulty means that it will be more challenging for miners to find a valid solution to the mathematical problems they are working on, which could lead to lower profits.
In this situation, the overall hash rate of the network may decrease, as some miners may choose to leave the network or scale back their mining operations. This could make the network more vulnerable to attacks, as a lower hash rate means that there is less computing power available to secure the network.
Metric #5 Active Addresses compared to Bitcoin
Next, let’s compare the number of active addresses between Ethereum and Bitcoin. An active address in a blockchain is a unique address that has conducted a transaction within a certain time period. The number of active addresses on a blockchain can be a useful metric for analyzing the usage and adoption of the network. There are several reasons why active addresses are important:
- Network usage: The number of active addresses can give an indication of how much the network is being used. A higher number of active addresses may suggest that more people are using the network to send and receive transactions.
- Network growth: An increase in the number of active addresses over time may indicate that the network is growing and attracting more users. This could be a positive sign for the long-term health and sustainability of the network.
- Network health: The number of active addresses may also provide insight into the overall health of the network. For example, a sudden drop in the number of active addresses could be a sign of trouble, such as a loss of user confidence or a technical issue.
- Network security: The number of active addresses can also be used as a rough proxy for the level of decentralization on the network. A large and diverse set of active addresses may indicate that the network is decentralized and less vulnerable to attacks.
# Calculate active addresses moving average
rolling_window=25
y_a_add_ma = onchain_symbol_a_df['active_addresses'].rolling(window=rolling_window).mean()
y_b_add_ma = onchain_symbol_b_df['active_addresses'].rolling(window=rolling_window).mean()

# Lineplot: Active Addresses
fig, ax1 = plt.subplots(figsize=(16, 6))
sns.lineplot(data=onchain_symbol_a_df[-1*data_limit::10], x='date', y='active_addresses',
    linewidth=0.5, color='skyblue', ax=ax1, label=f'{symbol_a} active addresses')
sns.lineplot(data=onchain_symbol_a_df[-1*data_limit::10], x='date', y=y_a_add_ma,
    linewidth=1.0, color='royalblue', linestyle='--', ax=ax1, label=f'{symbol_a} active addresses {rolling_window}-Day MA')
sns.lineplot(data=onchain_symbol_b_df[-1*data_limit::10], x='date', y='active_addresses',
    linewidth=0.5, color='lightcoral', ax=ax1, label=f'{symbol_b} active addresses')
sns.lineplot(data=onchain_symbol_b_df[-1*data_limit::10], x='date', y=y_b_add_ma,
    linewidth=1.0, color='red', linestyle='--', ax=ax1, label=f'{symbol_b} active addresses {rolling_window}-Day MA')
ax1.set(xlabel=None)
ax1.set(ylabel='Active Addresses')
plt.title(f'Active Addresses: {symbol_b} vs {symbol_a}')
plt.legend(framealpha=0)
plt.show()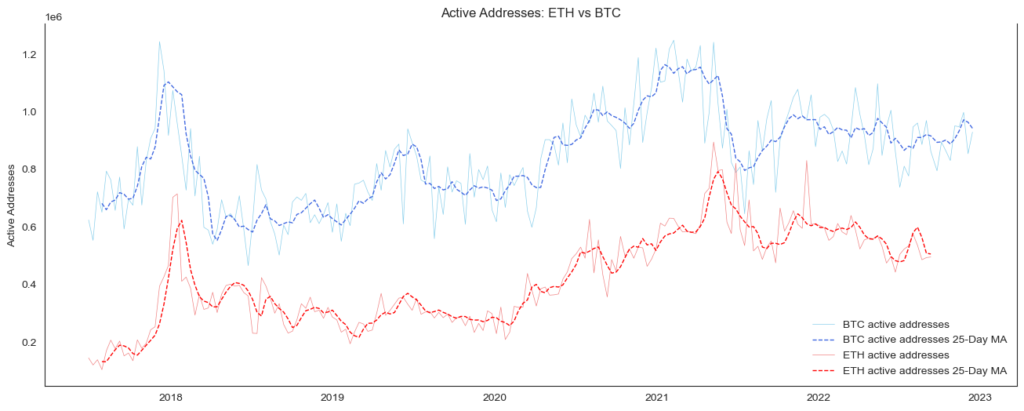
Metric #6 Transaction Count compared to Bitcoin
Transaction count is an important metric for analyzing the usage and adoption of a blockchain. It refers to the total number of transactions that have been processed on the network over a given time period.
There are several reasons why transaction count is important:
- Network usage: The transaction count can give an indication of network usage. A higher transaction count may suggest that more people are using the network to send and receive transactions.
- Network growth: An increase in the transaction count over time may indicate that the network is growing and attracting more users. This could be a positive sign for the long-term health and sustainability of the network.
- Network health: The transaction count may also provide insight into the overall health of the network. For example, a sudden drop in the transaction count could be a sign of trouble, such as a loss of user confidence or a technical issue.
- Network security: The transaction count can be used as a rough proxy for the level of decentralization on the network. A large and diverse set of transactions may indicate that the network is decentralized and less vulnerable to attacks.
# Calculate Transaction Count Moving Averages
rolling_window=25
y_a_trx_ma = onchain_symbol_a_df['transaction_count'].rolling(window=rolling_window).mean()
y_b_trx_ma = onchain_symbol_b_df['transaction_count'].rolling(window=rolling_window).mean()

# Lineplot: Transactions Count
fig, ax1 = plt.subplots(figsize=(16, 6))
sns.lineplot(data=onchain_symbol_a_df[-1*data_limit::10], x='date', y='transaction_count',
    linewidth=0.5, color='skyblue', ax=ax1, label=f'{symbol_a} transactions')
sns.lineplot(data=onchain_symbol_a_df[-1*data_limit::10], x='date', y=y_a_trx_ma,
    linewidth=1.0, color='royalblue', linestyle='--', ax=ax1, label=f'{symbol_a} transactions {rolling_window}-Day MA')
sns.lineplot(data=onchain_symbol_b_df[-1*data_limit::10], x='date', y='transaction_count',
    linewidth=0.5, color='lightcoral', ax=ax1, label=f'{symbol_b} transactions')
sns.lineplot(data=onchain_symbol_b_df[-1*data_limit::10], x='date', y=y_b_trx_ma,
    linewidth=1.0, color='red', linestyle='--', ax=ax1, label=f'{symbol_b} transactions {rolling_window}-Day MA')
ax1.set(xlabel=None)
ax1.set(ylabel='Transaction Count')
plt.legend(framealpha=0)
plt.title(f'Transactions: {symbol_b} vs {symbol_a}')
plt.show()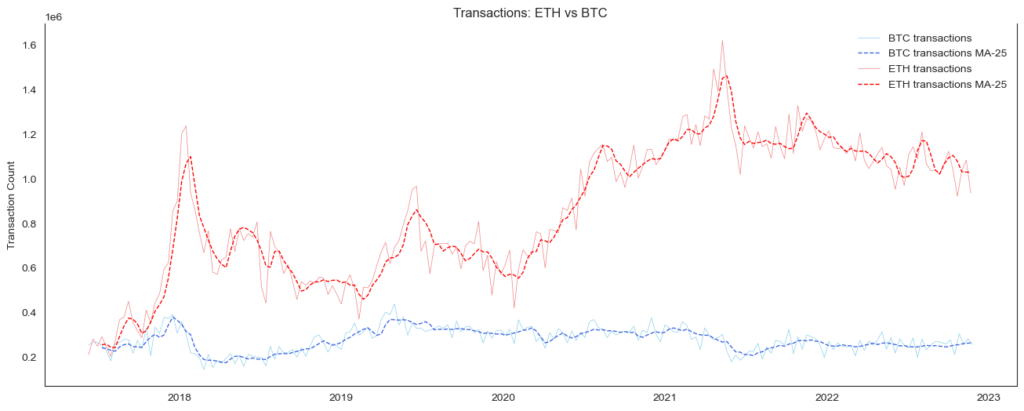
As the first blockchain, Bitcoin has always been the most crucial cryptocurrency in the crypto space. However, there are now blockchains based on more modern methods. Recently, the crypto community has been discussing whether Ethereum is about to overtake Bitcoin. But how is the situation in terms of transactions?
The chart shows that the use of blockchains has changed throughout the last few years. Ethereum has seen strong growth in the number of transactions, while the number of Bitcoin transactions has stagnated for some time.
Metric #7 Large Transactions compared to Bitcoin
Another metric to look at is the number of large transactions. Large transactions on a blockchain, also known as “whale transactions,” refer to transactions involving a significant amount of cryptocurrency. These transactions may be important to analyze for a number of reasons:
- Market impact: Large transactions can have a significant impact on the market, as they involve a large amount of cryptocurrency being bought or sold. This can affect the supply and demand for the cryptocurrency and potentially impact its price.
- Network security: Large transactions may also be of interest from a security standpoint, as they may be more likely to attract the attention of attackers. If a large transaction is successfully compromised, it could have a significant impact on the network.
- Network health: Large transactions may provide insight into the overall health of the network. For example, a sudden increase in large transactions may indicate an increased demand for cryptocurrency, while a decrease in large transactions could be a sign of trouble.
- Network usage: Large transactions can also be an indicator of how the network is being used. For example, a high number of large transactions may suggest that the network is being used for high-value transactions, while a low number may suggest that it is being used for smaller, everyday transactions.
# Calculate Large Transactions Moving Averages
rolling_window=25
y_a_ltrx_ma = onchain_symbol_a_df['large_transaction_count'].rolling(window=rolling_window).mean()
y_b_ltrx_ma = onchain_symbol_b_df['large_transaction_count'].rolling(window=rolling_window).mean()
# Lineplot: Large Transactions
fig, ax1 = plt.subplots(figsize=(16, 6))
sns.lineplot(data=onchain_symbol_a_df[-1*data_limit::10], x='date', y='large_transaction_count',
    linewidth=0.5, color='skyblue', ax=ax1, label=f'{symbol_a} large transactions')
sns.lineplot(data=onchain_symbol_a_df[-1*data_limit::10], x='date', y=y_a_ltrx_ma,
    linewidth=1.0, color='royalblue', linestyle='--', ax=ax1, label=f'{symbol_a} large transactions MA-{window}')
sns.lineplot(data=onchain_symbol_b_df[-1*data_limit::10], x='date', y='large_transaction_count',
    linewidth=0.5, color='lightcoral', ax=ax1, label=f'{symbol_b} large transactions')
sns.lineplot(data=onchain_symbol_b_df[-1*data_limit::10], x='date', y=y_b_ltrx_ma,
    linewidth=1.0, color='red', linestyle='--', ax=ax1, label=f'{symbol_b} large transaction MA-{window}')
ax1.set(ylabel='Large Transactions')
plt.title(f'Large Transactions > 100k: {symbol_b} vs {symbol_a}')
plt.legend(framealpha=0)
plt.show()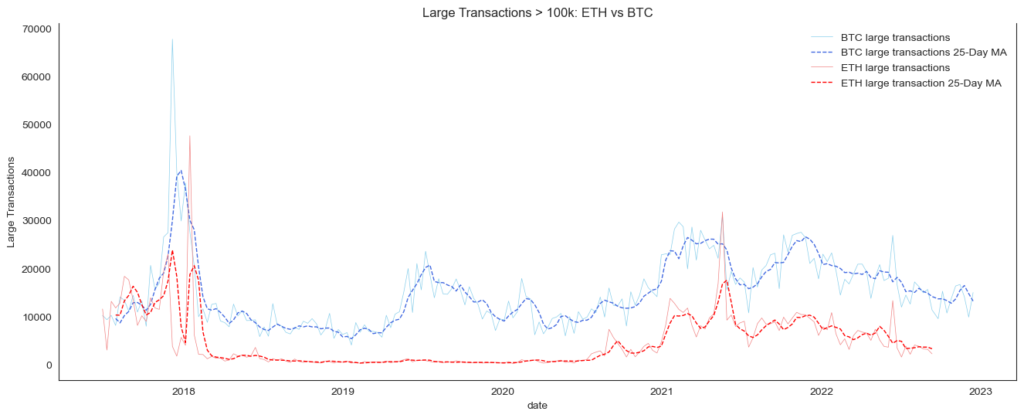
As we can see, both networks have recently experienced a decline in the number of large transactions.
Summary
Bitcoin and blockchain technology are transforming the financial sector and have seen increasing adoption during the past decade. Due to the increasing need to better understand complex blockchain networks, the importance of on-chain analytics is growing. This article has demonstrated how we can analyze blockchain data with Python. We used the CryptoCompare API to query various On-Chain and Off-Chain data for Bitcoin and Ethereum. By combining blockchain with these data, we gained several important insights into what has been happening in the crypto space over the past few years. Among other things, we have
- …compared the historical evolution of mining difficulty and network hash rate.
- …analyzed the usage of the Ethereum and Bitcoin blockchains.
- …and highlighted how the distribution of Bitcoin holdings has evolved in the past years.
Our analysis in this article focused solely on Bitcoin and Ethereum. However, you can easily analyze other blockchains by replacing the symbols used in the API calls.
I hope you liked this post, and I would appreciate your feedback. Is OnChain analysis a topic that you want to see covered more often? Or do you want to see more articles on deep learning and machine learning? Let me know in the comments.
Sources and Further Reading
- Antony Lewis (2018) Basics of Bitcoins and Blockchains
- CryptoCompare API
- glassnode.com
- OpenAI ChatGPT was carefully used to revise certain parts of this article
The links above to Amazon are affiliate links. By buying through these links, you support the Relataly.com blog and help to cover the hosting costs. Using the links does not affect the price.