How to Use Hierarchical Clustering For Customer Segmentation in Python

Have you ever found yourself wondering how you can better understand your customer base and target your marketing efforts more effectively? One solution is to use hierarchical clustering, a method of grouping customers into clusters based on their characteristics and behaviors. By dividing your customers into distinct groups, you can tailor your marketing campaigns and personalize your marketing efforts to meet the specific needs of each group. This can be especially useful for businesses with large customer bases, as it allows them to target their marketing efforts to specific segments rather than trying to appeal to everyone at once. Additionally, hierarchical clustering can help businesses identify common patterns and trends among their customers, which can be useful for targeting future marketing efforts and improving the overall customer experience. In this tutorial, we will use Python and the scikit-learn library to apply hierarchical (agglomerative) clustering to a dataset of customer data.
The rest of this tutorial proceeds in two parts. The first part will discuss hierarchical clustering and how we can use it to identify clusters in a set of customer data. The second part is a hands-on Python tutorial. We will explore customer health insurance data and apply an agglomerative clustering approach to group the customers into meaningful segments. Finally, we will use a tree-like diagram called a dendrogram, which is helpful for visualizing the structure of the data. The resulting segments could inform our marketing strategies and help us better understand our customers. So let’s get started!
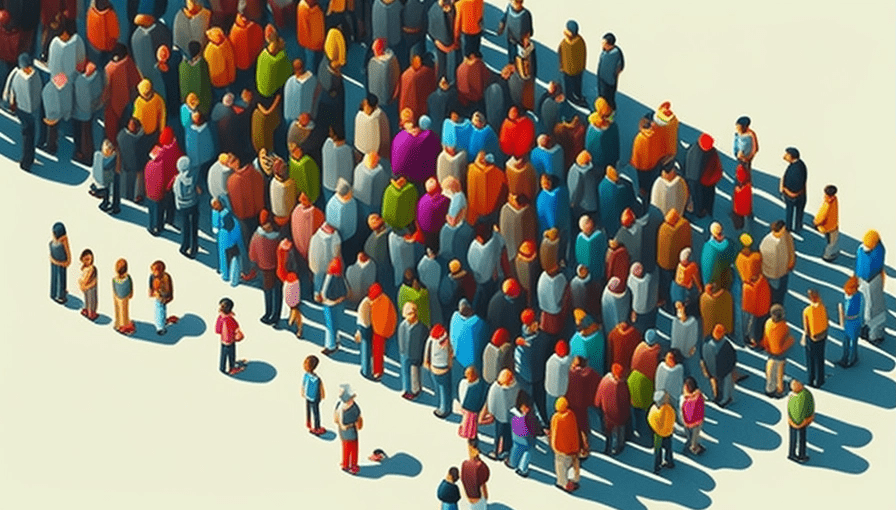
Customer segmentation is a typical use case for clustering. Image generated with Midjourney.
What is Hierarchical Clustering?
So what is hierarchical clustering? Hierarchical clustering is a method of cluster analysis that aims to build a hierarchy of clusters. It creates a tree-like diagram called a dendrogram, which shows the relationships between clusters. There are two main types of hierarchical clustering: agglomerative and divisive.
- Agglomerative hierarchical clustering: This is a bottom-up approach in which each data point is treated as a single cluster at the outset. The algorithm iteratively merges the most similar pairs of clusters until all data points are in a single cluster.
- Divisive hierarchical clustering: This is a top-down approach in which all data points are treated as a single cluster at the outset. The algorithm iteratively splits the cluster into smaller and smaller subclusters until each data point is in its own cluster.
Agglomerative Clustering
In this article, we will apply the agglomerative clustering approach, which is a bottom-up approach to clustering. The idea is to initially treat each data point in a dataset as its own cluster and then combine the points with other clusters as the algorithm progresses. The process of agglomerative clustering can be broken down into the following steps:
- Start with each data point in its own cluster.
- Calculate the similarity between all pairs of clusters.
- Merge the two most similar clusters.
- Repeat steps 2 and 3 until all the data points are in a single cluster or until a predetermined number of clusters is reached.
There are several ways to calculate the similarity between clusters, including using measures such as the Euclidean distance, cosine similarity, or the Jaccard index. The specific measure used can impact the results of the clustering algorithm.
For details on how the clustering approach works, see the Wikipedia page.
Hierarchical clustering is an unsupervised technique to classify things based on patterns in their data. Image created with Midjourney.
Hierarchical Clustering vs. K-means
In a previous article, we have already discussed the popular clustering approach k-means. So how are k-means and hierarchical clustering different? Hierarchical clustering and k-means are both clustering algorithms that can be used to group similar data points together. However, there are several key differences between these two approaches:
- The number of clusters: In k-means, the number of clusters must be specified in advance, whereas in hierarchical clustering, the number of clusters is not specified. Instead, hierarchical clustering creates a hierarchy of clusters, starting with each data point as its own cluster and then merging the most similar clusters until all data points are in a single cluster.
- Cluster shape: K-means produces clusters that are spherical, while hierarchical clustering produces clusters that can have any shape. This means that k-means is better suited for data that is well-separated into distinct, spherical clusters, while hierarchical clustering is more flexible and can handle more complex cluster shapes.
- Distance measure: K-means uses a distance measure, such as the Euclidean distance, to calculate the similarity between data points, while hierarchical clustering can use a variety of distance measures. This means that k-means is more sensitive to the scale of the features, while hierarchical clustering is less sensitive to the feature scale.
- Computational complexity: K-means is generally faster than hierarchical clustering, especially for large datasets. This is because k-means only requires a single pass through the data to assign data points to clusters, while hierarchical clustering requires multiple passes to merge clusters.
- Visualization: Hierarchical clustering produces a tree-like diagram called a “dendrogram.” The dendrogram shows the relationships between clusters. This can be useful for visualizing the structure of the data and understanding how clusters are related.
Next, let’s look at how we can implement a hierarchical clustering model in Python.
Customer Segmentation using Hierarchical Clustering in Python
In this comprehensive guide, we explore the application of hierarchical clustering for effective customer segmentation using a customer dataset. This data-driven segmentation method enables businesses to identify distinct customer clusters based on various factors, including demographics, behaviors, and preferences.
Customer segmentation is a strategic approach that splits a customer base into smaller, more manageable groups with similar characteristics. It aims to better understand the diverse needs and wants of different customer segments to enhance marketing strategies and product development.
Applying customer segmentation through hierarchical clustering allows businesses to personalize their marketing messages, design targeted campaigns, and tailor products to meet the unique needs of each segment. This proactive approach can stimulate increased customer loyalty and sales.
We begin by loading the customer data and selecting the relevant features we want to use for clustering. We then standardize the data using the StandardScaler from scikit-learn. Next, we apply hierarchical clustering using the AgglomerativeClustering method, specifying the number of clusters we want to create. Finally, we add the predictions to the original data as a new column and view the resulting segments by calculating the mean of each feature for each segment.
The code is available on the GitHub repository.

The future of healthcare will see a tight collaboration between humans and AI. Image generated using Midjourney
About the Customer Health Insurance Dataset
In this tutorial, we will work with a public dataset on health_insurance_customer_data from kaggle.com. Download the CSV file from Kaggle and copy it into the following path, starting from the folder with your python notebook: data/customer/
The dataset is relatively simple and contains 1338 rows of insured customers. It includes the insurance charges, as well as demographic and personal information such as Age, Sex, BMI, Number of Children, Smoker, and Region. The dataset does not have any undefined or missing values.
Prerequisites
Before we start the coding part, ensure that you have set up your Python 3 environment and the required packages. If you don’t have an environment, follow this tutorial to set up the Anaconda environment. Also, make sure you install all required packages. In this tutorial, we will be working with the following standard packages:
- pandas
- NumPy
- matplotlib
- scikit-learn
You can install packages using console commands:
pip install <package name>
conda install <package name> (if you are using the anaconda packet manager)
Step #1 Load the Data
To begin, we need to load the required packages and the data we want to cluster. We will load the data by reading the CSV file via the pandas library.
# import necessary libraries
import matplotlib.pyplot as plt
from sklearn.preprocessing import StandardScaler
from sklearn.cluster import AgglomerativeClustering
from sklearn.preprocessing import LabelEncoder
from pandas.api.types import is_string_dtype
import pandas as pd
import math
import seaborn as sns

# load customer data
customer_df = pd.read_csv("data/customer/customer_health_insurance.csv")
customer_df.head(3)
age sex bmi children smoker region charges
0 19 female 27.90 0 yes southwest 16884.9240
1 18 male 33.77 1 no southeast 1725.5523
2 28 male 33.00 3 no southeast 4449.4620Step #2 Explore the Data
Next, it is a good idea to explore the data and get a sense of its structure and content. This can be done using a variety of methods, such as examining the shape of the dataframe, checking for missing values, and plotting some basic statistics. For example, the following plots will explore the relationships between some of the variables. We won’t go into too much detail here.
def make_kdeplot(df, column_name, target_name):
    fig, ax = plt.subplots(figsize=(10, 6))
    sns.kdeplot(data=df, hue=column_name, x=target_name, ax = ax, linewidth=2,)
    ax.tick_params(axis="x", rotation=90, labelsize=10, length=0)
    ax.set_title(column_name)
    ax.set_xlim(0, df[target_name].quantile(0.99))
    plt.show()

# make kde plot for ext_color
make_kdeplot(customer_df, 'smoker', 'charges')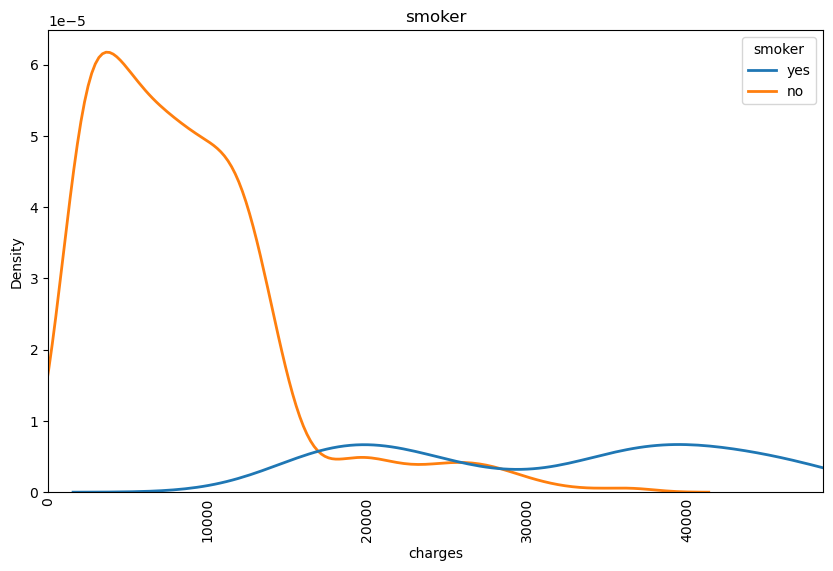
# make kde plot for ext_color
make_kdeplot(customer_df, 'sex', 'charges')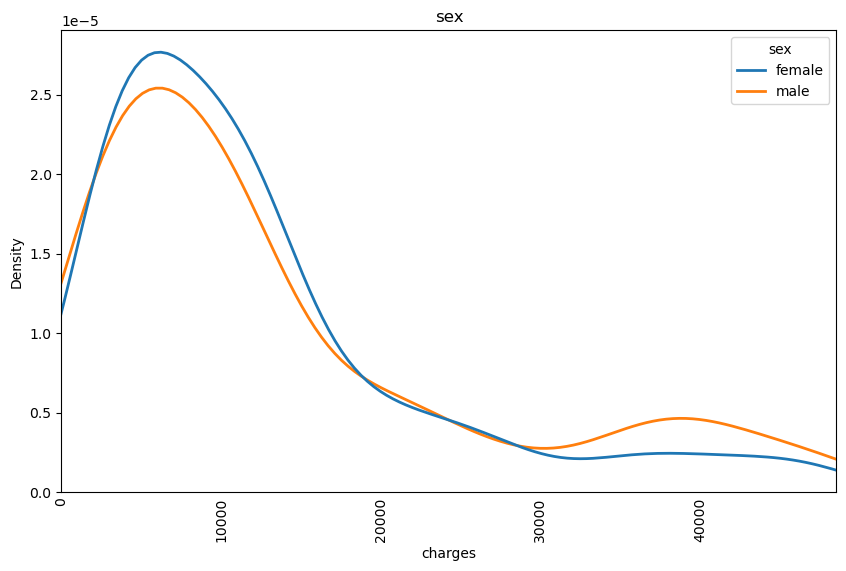
sns.lmplot(x="charges", y="age", hue="smoker", data=customer_df, aspect=2)
plt.show()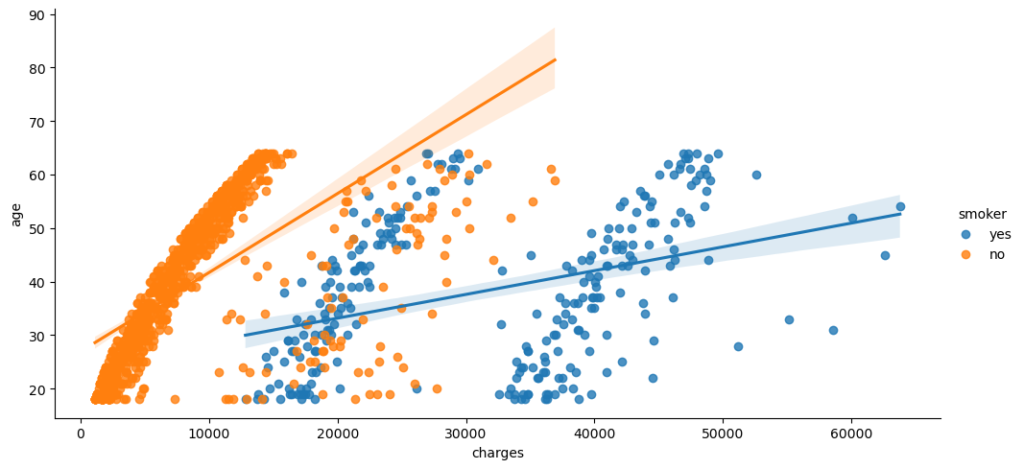
def make_boxplot(customer_df, x,y,h):
    fig, ax = plt.subplots(figsize=(10,4))
    box = sns.boxplot(x=x, y=y, hue=h, data=customer_df)
    box.set_xticklabels(box.get_xticklabels())
    fig.subplots_adjust(bottom=0.2)
    plt.tight_layout()

make_boxplot(customer_df, "smoker", "charges", "sex")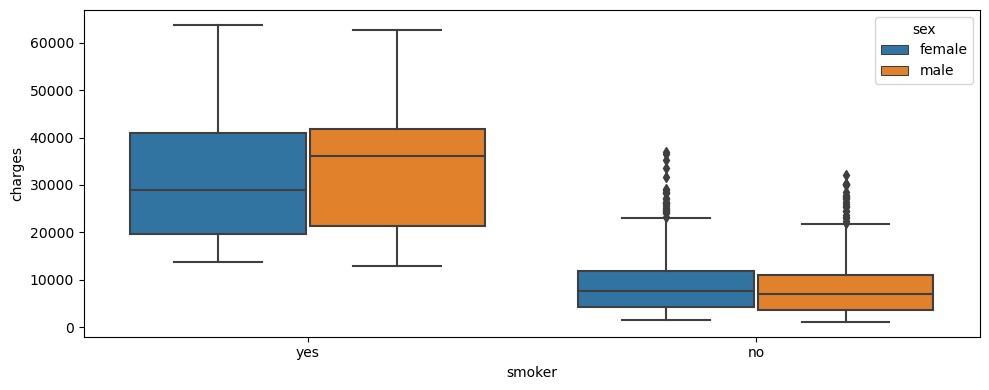
make_boxplot(customer_df, "region", "charges", "sex")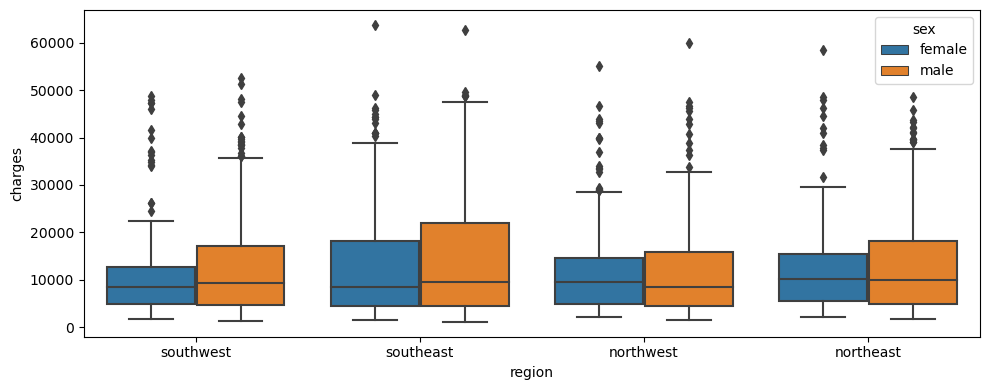
make_boxplot(customer_df, "children", "bmi", "sex")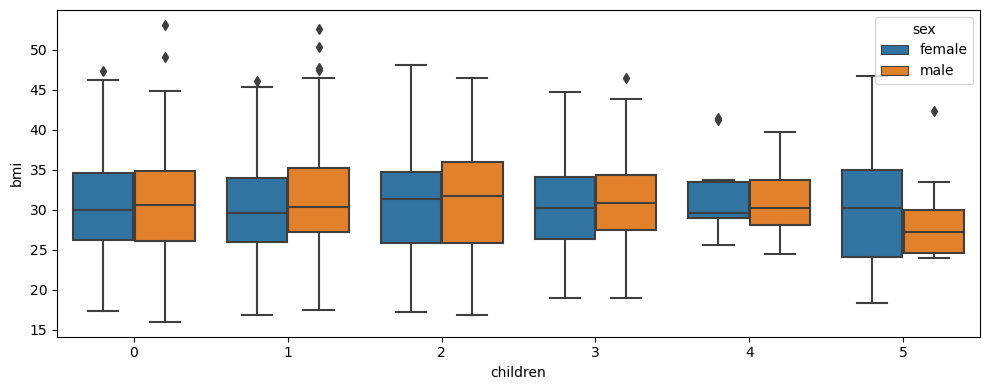
Next, let’s prepare the data for model training.
Step #3 Prepare the Data
Before we can train a model on the data, we must prepare it for modeling. This typically involves selecting the relevant features, handling missing values, and scaling the data. However, we are using a very simple dataset that already has good data quality. Therefore we can limit our data preparation activities to encoding the labels and scaling the data.
To encode the categorical values, we will use label encoder from the scikit-learn library.
# encode categorical features
label_encoder = LabelEncoder()

for col_name in customer_df.columns:
    if (is_string_dtype(customer_df[col_name])):
        customer_df[col_name] = label_encoder.fit_transform(customer_df[col_name])
customer_df.head(3)
Next, we will scale the numeric variables. While scaling the data is an essential preprocessing step for many machine learning algorithms to work effectively, it is generally not necessary for hierarchical clustering. This is because hierarchical clustering is not sensitive to the scale of the features. However, when you use certain distance measures, such as Euclidean distance, scaling the data might still be useful when performing hierarchical clustering. Scaling the data can help to ensure that all of the features are given equal weight. This can be useful if you want to avoid giving more weight to features with larger scales.
# select features
X = customer_df # we will select all features

# standardize the data
scaler = StandardScaler()
X_scaled = scaler.fit_transform(X)
X_scaled.head(3)
array([[-1.43876426, -1.0105187 , -0.45332 , ..., 1.34390459,
0.2985838 , 1.97058663],
[-1.50996545, 0.98959079, 0.5096211 , ..., 0.43849455,
-0.95368917, -0.5074631 ],
[-0.79795355, 0.98959079, 0.38330685, ..., 0.43849455,
-0.72867467, -0.5074631 ],
...,
[-1.50996545, -1.0105187 , 1.0148781 , ..., 0.43849455,
-0.96159623, -0.5074631 ],
[-1.29636188, -1.0105187 , -0.79781341, ..., 1.34390459,
-0.93036151, -0.5074631 ],
[ 1.55168573, -1.0105187 , -0.26138796, ..., -0.46691549,
1.31105347, 1.97058663]])Step #4 Train the Hierarchical Clustering Algorithm
To train a hierarchical clustering model using scikit-learn, we can use the AgglomerativeClustering or Ward class. The main parameters for these classes are:
- n_clusters: The number of clusters to form. This parameter is required for AgglomerativeClustering but is not used for
Ward. - affinity: The distance measure used to calculate the similarity between pairs of samples. This can be any of the distance measures implemented in scikit-learn, such as the Euclidean distance or the cosine similarity.
- linkage: The method used to calculate the distance between clusters. This can be one of “ward,” “complete,” “average,” or “single.”
- distance_threshold: The maximum distance between two clusters that allows them to be merged. This parameter is only used in the AgglomerativeClustering class.
To train the model, we specify the desired parameters and fit the model to the data using the fit_predict method. This method will fit the model to the data and generate predictions in one step.
# apply hierarchical clustering
model = AgglomerativeClustering(affinity='euclidean')
predicted_segments = model.fit_predict(X_scaled)
Now we have a trained clustering model also predicted the segments for our data.
Step #5 Visualize the Results
After the model is trained, we can visualize the results to get a better understanding of the clusters that were formed. There is a wide range of plots and tools to visualize clusters. In this tutorial, we will use a scatterplot and a dendrogram.
5.1 Scatterplot
For this, we can use the lmplot function in Seaborn. The lmplot creates a 2D scatterplot with an optional overlay of a linear regression model. The plot visualizes the relationship between two variables and fits a linear regression model to the data that can highlight differences. In the following, we use this linear regression model to highlight the differences between our two cluster segments and the age of the customers.
# add predictions to data as a new column
customer_df['segment'] = predicted_segments

# create a scatter plot of the first two features, colored by segment
sns.lmplot(x="charges", y="age", hue="segment", data=customer_df, aspect=2)
plt.show()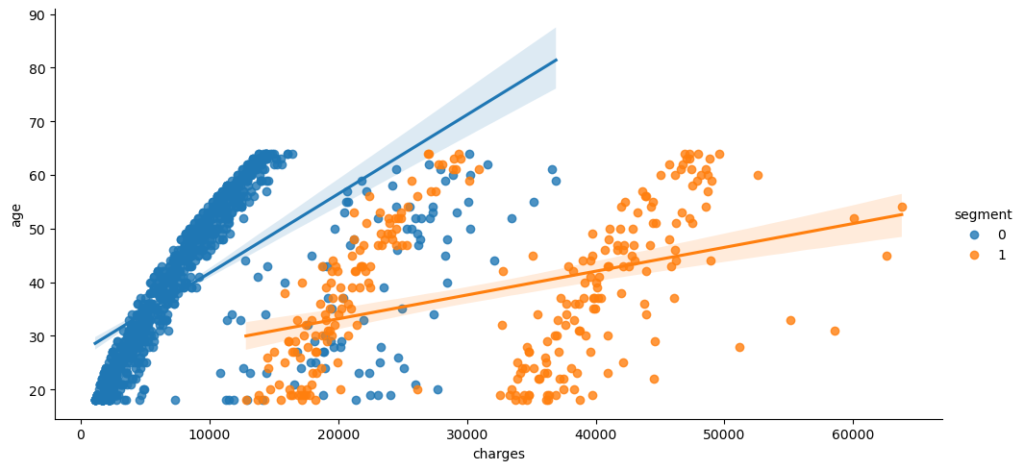
We can see that our model has determined two clusters in our data. The clusters seem to correspond well with the smoker category, which indicates that this attribute is decisive in forming relevant groups.
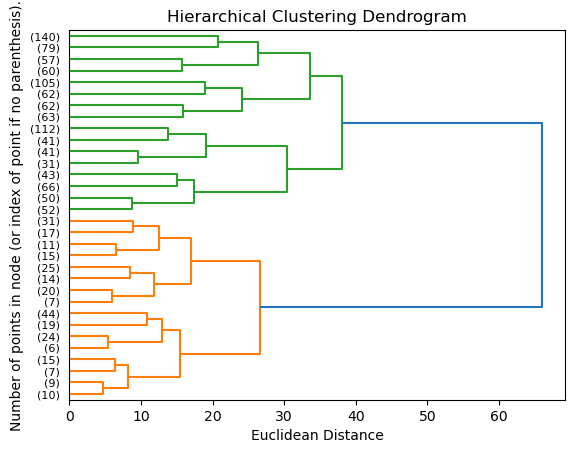
5.2 Dendrogram
The hierarchical clustering approach lets us visualize relationships between different groups in our dataset in a dendrogram. A dendrogram is a graphical representation of a hierarchical structure, such as the relationships between different groups of objects or organisms. It is typically used in biology to show the relationships between different species or taxonomic groups, but it can also be used in other fields to represent the hierarchical structure of any set of data. In a dendrogram, the objects or groups being studied are represented as branches on a tree-like diagram. The branches are usually labeled with the names of the objects or groups, and the lengths of the branches represent the distances or dissimilarities between the objects or groups. The branches are also arranged in a hierarchical manner, with the most closely related objects or groups being placed closer together and the more distantly related ones being placed farther apart.
# Visualize data similarity in a dendogram
def plot_dendrogram(model, **kwargs):
    # create the counts of samples under each node
    counts = np.zeros(model.children_.shape[0])
    n_samples = len(model.labels_)
    for i, merge in enumerate(model.children_):
        current_count = 0
        for child_idx in merge:
            if child_idx < n_samples:
                current_count += 1  # leaf node
            else:
                current_count += counts[child_idx - n_samples]
        counts[i] = current_count

    linkage_matrix = np.column_stack(
        [model.children_, model.distances_, counts]
    ).astype(float)

    # Plot the corresponding dendrogram
    dendrogram(linkage_matrix, orientation='right',**kwargs)

plt.title("Hierarchical Clustering Dendrogram")
# plot the top three levels of the dendrogram
plot_dendrogram(cluster_model, truncate_mode="level", p=4)
plt.xlabel("Euclidean Distance")
plt.ylabel("Number of points in node (or index of point if no parenthesis).")
plt.show()
Source: This code block is based on code from the scikit-learn page
Summary
In conclusion, hierarchical clustering is a powerful tool for customer segmentation that can help businesses better understand their customer base and target their marketing efforts more effectively. By grouping customers into clusters based on their characteristics and behaviors, companies can create targeted campaigns and personalize their marketing efforts to better meet the needs of each group. Using Python and the scikit-learn library, we were able to apply an agglomerative clustering approach to a dataset of customer data and identify two distinct segments. We can then use these segments to inform our marketing strategies and get a better understanding of our customers.
By the way, customer segmentation is an area where real-world data can be prone to bias and unfairness. If you’re concerned about this, check out our latest article on addressing fairness in machine learning with fairlearn.
I hope this article was useful. If you have any feedback, please write your thoughts in the comments.
Sources and Further Reading
Articles
- https://scikit-learn.org/stable/auto_examples/cluster/plot_agglomerative_dendrogram.html
- Images generated with OpenAI Dall-E and Midjourney.
Books on Clustering
- “Data Clustering: Algorithms and Applications” by Charu C. Aggarwal: This book covers a wide range of clustering algorithms, including hierarchical clustering, and discusses their applications in various fields.
- “Data Mining: Practical Machine Learning Tools and Techniques” by Ian H. Witten and Eibe Frank: This book is a comprehensive introduction to data mining and machine learning, including a chapter on hierarchical clustering.
Books on Machine Learning
- Aurélien Géron (2019) Hands-On Machine Learning
- David Forsyth (2019) Applied Machine Learning Springer
The links above to Amazon are affiliate links. By buying through these links, you support the Relataly.com blog and help to cover the hosting costs. Using the links does not affect the price.
Relataly articles on clustering and machine learning
- Simple Clustering using K-means in Python: This article gives an overview of cluster analysis with k-means.
- Clustering crypto markets using affinity propagation in Python: This article applies cluster analysis to crypto markets and creates a market map for various cryptocurrencies.
- Addressing fairness in machine learning with the fairlearn library