Tuning Model Hyperparameters with Grid Search at the Example of Training a Random Forest Classifier in Python

Are you struggling to find the best hyperparameters for your machine learning model? With Python’s Scikit-learn library, you can use grid search to fine-tune your model and improve its performance. In this article, we’ll guide you through the process of hyperparameter tuning for a classification model, using a random decision forest that predicts the survival of Titanic passengers as an example.
We’ll start by explaining the concept of grid search and how it works. Then, we’ll dive into the development and optimization of the random decision forest using Python. By defining a parameter grid and feeding it to the grid search algorithm, we can explore all possible hyperparameter combinations and find the optimal configuration for our model.
Finally, we’ll compare the performance of different model configurations to determine the best one for our classification task. Whether you’re new to machine learning or looking to boost the performance of an existing model, this step-by-step guide to hyperparameter tuning with grid search will help you achieve better results. Let’s get started!
Also: Multivariate Anomaly Detection on Time-Series Data in Python
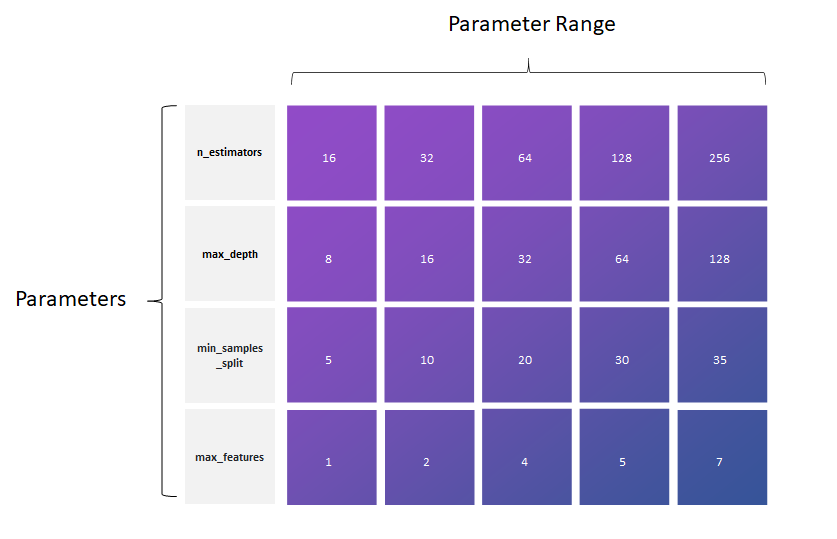
Exemplary parameter grid for the tuning of a random decision forest with four hyperparameters
What are Hyperparameters?
Hyperparameters play a crucial role in the performance of a machine learning model. They are adjustable parameters that influence the model training process and control how a machine learning algorithm learns and how it behaves.
Unlike the internal parameters (coefficients, etc.) that the algorithm automatically optimizes during model training, hyperparameters are model characteristics (e.g., the number of estimators for an ensemble model) that we must set in advance.
Which hyperparameters are available, depends on the algorithm. For example, a random decision forest model may have hyperparameters such as the number of trees and tree depth, while a neural network model may have hyperparameters such as the number of hidden layers and nodes in each layer. Finding the optimal configuration of hyperparameters can be a challenging task, as there is often no way to know in advance what the ideal values should be.
This requires experimentation with different hyperparameter settings, which can be time-consuming if done manually. Grid search is a useful tool for automating this process and efficiently finding the best hyperparameter configuration for a given model.

Hyperparameters are the little screws that we can adjust to tune a predictive model.
Efficient Hyperparameter Tuning with Exhaustive Grid Search
When we train a machine learning model, it is usually unclear which hyperparameters lead to good results. While there are estimates and rules of thumb, there is often no way to avoid trying out hyperparameters in experiments. However, machine learning models often have several hyperparameters that affect the model’s performance in a nonlinear way.
We can use grid search to automate searching for optimal model hyperparameters. The search grid algorithm exhaustively generates models from parameter permutations of a grid of parameter values. Let’s take a look at how this works.
Hyperparameter Tuning with Grid Search: How it Works
The idea behind the grid search technique is quite simple. We have a model with parameters, and the challenge is to test various configurations until we are satisfied with the result. Grid search is exhaustive in that it tests all permutations of a parameter grid. The number of model variants results from the parameter grid and the specified parameters.
The grid search algorithm requires us to provide the following information:
- The hyperparameters that we want to configure (e.g., tree depth)
- For each hyperparameter, a range of values (e.g., [50, 100, 150])
- A performance metric so that the algorithm knows how to measure performance (e.g., accuracy for a classification model)
For example, imagine we have a range of [16, 32, and 64] for n_estimators and a range of [8, 16, and 32] for max_depth. Then, the search grid will test 9 different parameter configurations.
Early Stopping
Running parameter optimization against an entire grid can be time-consuming, but there are ways to shorten the process. Depending on how much time you want to invest in the search process, you can test all combinations exhaustively or shorten the process with an early stopping logic. A stopping logic defines that the search ends early when a specific criterion is met. Such a criterion could be, for example, that newly trained models underperform the average performance of previously trained models by a certain value. In this case, the search stops and returns the best models found up to that point. When you define a large search grid with many parameters, defining an early stopping logic is recommended.
Strengths and Weaknesses of Grid Search
The advantage of the grid search is that the algorithm automatically identifies the optimal parameter configuration from the parameter grid. However, the number of possible configurations increases exponentially with the number of values in the parameter grid. So, in practice, defining a sparse parameter grid or defining stopping criteria is essential.
Grid Search is only one of several techniques that can be used to tune the hyperparameters of a predictive model. Alternative techniques include Random Search. In contrast to Grid Search, Random Search is a non-exhaustive hyperparameter-tuning technique, which randomly selects and tests specific configurations from a predefined search space. Further optimization techniques are Bayesian Search and Gradient Descent.
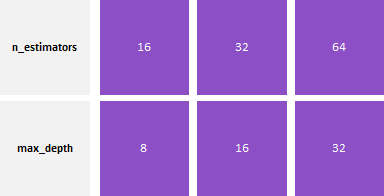
A parameter grid with two hyperparameters and respectively three hyperparameter values
Evaluation Metrics
The question of which metric to optimize against inevitably arises when we talk about optimization. Generally, all common metrics available for classification or regression come into question.
Metrics for regression (more detailed description)
- Mean Absolute Error (MAE)
- Root Mean Squared Absolute Error (RMSAE)
- Relative Squared Error (RSE).
Metrics for classification (more detailed description)
- Accuracy
- Precision
- F-1 Score
- Recall
Tuning the Hyperparameters of a Random Decision Forest Classifier in Python using Grid Search
Now that we have familiarized ourselves with the basic concept of hyperparameter tuning, let’s move on to the Python hands-on part! In this part, we will work with the Titanic dataset. We will apply the grid search optimization technique to a classification model. We will develop our Machine Learning model based on the Titanic dataset.
The sinking of the Titanic was one of the most catastrophic ship disasters, leading to more than 1500 casualties (The exact number is unknown due to several passengers being unregistered). The Titanic dataset contains a list of passengers with passenger information such as age, gender, cabin, ticket cost, etc., and whether they survived the Titanic sinking. The information about the passengers shows certain patterns that allow conclusions about the likelihood of the passengers surviving the accident. These data can be used to train a predictive model.
In the following, we will use the survival flag as a label and passenger information as input for a classification model. The goal is to predict whether a passenger will survive the Titanic sinking or not. The algorithm will be a random decision forest algorithm that classifies the passengers into two groups, survivors and non-survivors. Once we have trained a baseline model, we will apply grid search to optimize the hyperparameters of this model and select the best model.
The code is available on the GitHub repository.

Source: The National Archives/Heritage-Images/Imagestate
Prerequisites
Before starting the coding part, make sure that you have set up your Python 3 environment and required packages. If you don’t have a Python environment, follow this tutorial to set up the Anaconda environment.
Also, make sure you install all required packages. In this tutorial, we will be working with the following standard packages:
In addition, we will be using the Python Machine Learning library Scikit-learn to implement the random forest and the grid search technique.
You can install packages using console commands:
- pip install
- conda install
(if you are using the anaconda packet manager)
About the Titanic Dataset
In this article, we will be working with the popular titanic dataset for classification. The Titanic dataset is a well-known dataset that contains information about the passengers on the Titanic, a British passenger liner that sank in the North Atlantic Ocean in 1912 after colliding with an iceberg. The dataset includes variables such as the passenger’s name, age, fare, and class, as well as whether or not the passenger survived.
The titanic dataset contains the following information on passengers of the titanic:
- Survival: Survival 0 = No, 1 = Yes (Prediction Label)
- Pclass: Ticket class 1 = 1st, 2 = 2nd, 3 = 3rd
- Sex: Sex
- Age: Age in years
- SibSp: # of siblings/spouses aboard the Titanic
- Parch: # of parents/children aboard the Titanic
- Ticket: Ticket number
- Fare: Passenger fare
- Cabin: Cabin number
- Embarked: Port of Embarkation C = Cherbourg, Q = Queenstown, S = Southampton
The Survival column contains the prediction label, which states whether a passenger survived the sinking of the Titanic or not.
You can download the titanic dataset from the Kaggle website. Once you have completed the download, you can place the dataset in the file path of your choice. Using the Kaggle Python environment, you can directly save the dataset into your Kaggle project.

We can assume that the cabin location of the passengers had an impact on their chance of surviving the sinking.
Step #1 Load the Titanic Data
The following code will load the titanic data into our python project. If you have placed the data outside the path shown below, don’t forget to adjust the file path in the code.
import math
import numpy as np
import pandas as pd
import matplotlib.pyplot as plt
from sklearn.metrics import confusion_matrix
from sklearn.model_selection import GridSearchCV
from sklearn.ensemble import RandomForestClassifier
import seaborn as sns
from pandas.plotting import register_matplotlib_converters

# set file path
filepath = "data/titanic-grid-search/"

# Load train and test datasets
titanic_train_df = pd.read_csv(filepath + 'titanic-train.csv')
titanic_test_df = pd.read_csv(filepath + 'titanic-test.csv')
titanic_train_df.head()
PassengerId Survived Pclass Name Sex Age SibSp Parch Ticket Fare Cabin Embarked
0 1 0 3 Braund, Mr. Owen Harris male 22.0 1 0 A/5 21171 7.2500 NaN S
1 2 1 1 Cumings, Mrs. John Bradley ... female 38.0 1 0 PC 17599 71.2833 C85 C
2 3 1 3 Heikkinen, Miss. Laina female 26.0 0 0 STON/O2. 3101282 7.9250 NaN S
3 4 1 1 Futrelle, Mrs. Jacques ... female 35.0 1 0 113803 53.1000 C123 S
4 5 0 3 Allen, Mr. William Henry male 35.0 0 0 373450 8.0500 NaN SStep #2 Preprocessing and Exploring the Data
Before we can train a model, we preprocess the data:
- Firstly, we clean the missing values in the data and replace them with the mean.
- Second, we transform categorical features (Embarked and Sex) into numeric values. In addition, we will delete some columns to reduce model complexity.
- Finally, we delete the prediction label from the training dataset and place it into a separate dataset named y_df.
# Define a function for preprocessing the train and test data
def preprocess(df):

    # Delete some columns that we will not use
    new_df = df[df.columns[~df.columns.isin(['Cabin', 'PassengerId', 'Name', 'Ticket'])]].copy()

    # Replace missing values
    for i in new_df.select_dtypes(include=['int16', 'int32', 'int64', 'float16', 'float32', 'float64']).columns:
        new_df[i].fillna(new_df[i].mean(), inplace=True)
    new_df['Embarked'].fillna('C', inplace=True)

    # Decode categorical values as integer values
    new_df_b = new_df.copy()
    new_df_b['Sex'] = np.where(new_df_b['Sex']=='male', 0, 1)

    cleanups = {"Sex":     {"m": 0, "f": 1},
                "Embarked": {"S": 1, "Q": 2, "C": 3}}
    new_df_b.replace(cleanups, inplace=True)
    x = new_df_b.drop(columns=['Survived'])
    y = new_df_b['Survived']

    return x, y

# Create the training dataset train_df and the label dataset
x_df, y_df = preprocess(train_df)
x_df.head()
Pclass Sex Age SibSp Parch Fare Embarked
0 3 0 22.0 1 0 7.2500 1
1 1 1 38.0 1 0 71.2833 3
2 3 1 26.0 0 0 7.9250 1
3 1 1 35.0 1 0 53.1000 1
4 3 0 35.0 0 0 8.0500 1Let’s take a quick look at the data by creating paired plots for the columns of our data set. Pair plots help us to understand the relationships between pairs of variables in a dataset.
# # Create histograms for feature columns separated by prediction label value
df_plot = titanic_train_df.copy()

# class_columnname = 'Churn'
sns.pairplot(df_plot, hue="Survived", height=2.5, palette='muted')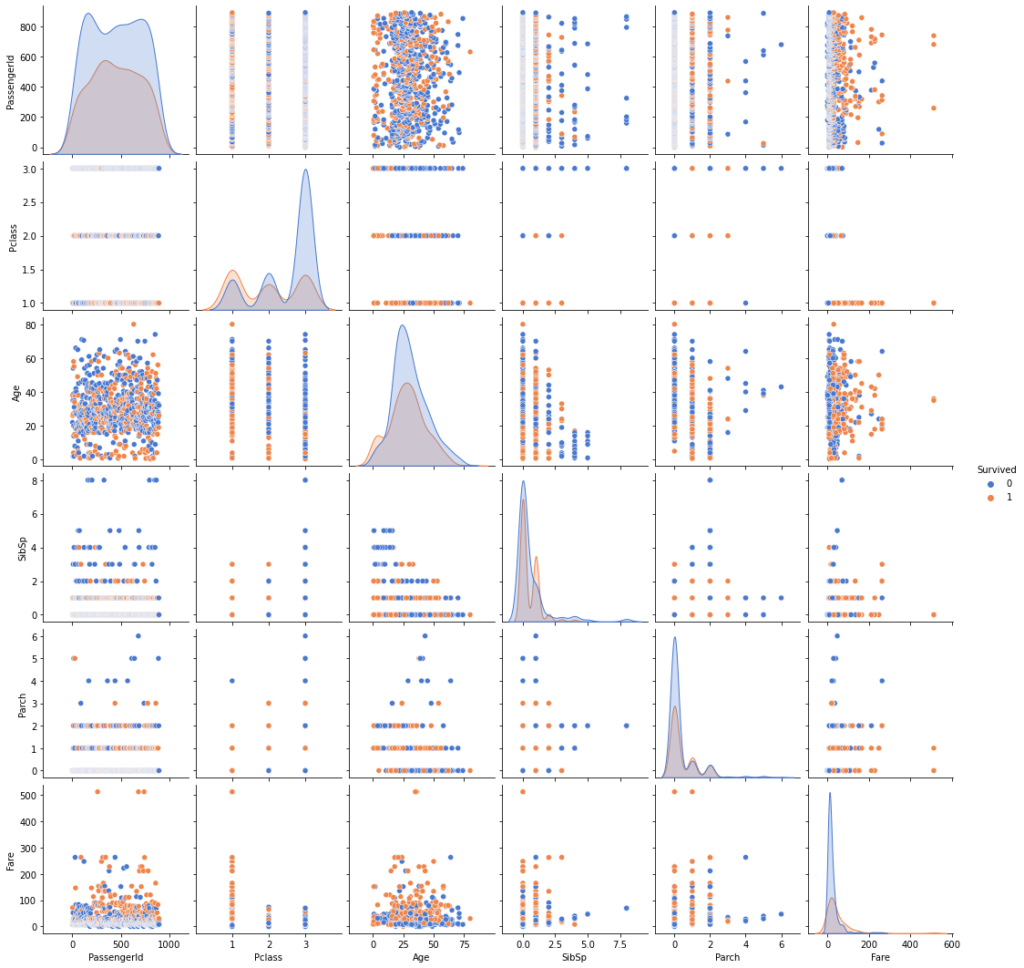
The histograms tell us various things. For example, most passengers were between 25 and 35 years old. In addition, we can see that most passengers had low-fare tickets, while some passengers had significantly more expensive tickets.
Step #3 Splitting the Data
Next, we will split the data set into training data (x_train, y_train) and test data (x_test, y_test) using a split ratio of 70/30.
# Split the data into x_train and y_train data sets
x_train, x_test, y_train, y_test = train_test_split(x_df, y_df, train_size=0.7, random_state=0)
Step #4 Building a Single Random Forest Model
After completing the preprocessing, we can train the first model. The model uses a random forest algorithm. The random forest algorithm has a large number of hyperparameters.
4.1 About the Random Forest Algorithm
A random forest is a robust predictive algorithm that can handle classification and regression tasks. As a so-called ensemble model, the random forest considers predictions from a group of several independent estimators.
Random decision forests have several hyperparameters that we can use to influence their behavior. However, not all of these hyperparameters have the same influence on model performance. Limiting the number of models by defining a sparse parameter grid is essential to reduce the amount of time needed to test the hyperparameters.
Therefore, we restrict the hyperparameters optimized by the grid search approach to the following two:
- n_estimators determine the number of decision trees in the forest
- max_depth defines the maximum number of branches in each decision tree
In the scikit-learn documentation, you also find a full list of available hyperparameters. For the rest of these hyperparameters, we will use the default value defined by scikit-learn.
4.2 Implementing a Random Forest Model
We train a simple baseline model and make a test prediction with the x_test dataset. Then we visualize the performance of the baseline model in a confusion matrix:
# Train a single random forest classifier
clf = RandomForestClassifier(max_depth=2, random_state=0, n_estimators = 100)
clf.fit(x_train, y_train)
y_pred = clf.predict(x_test)

# Create a confusion matrix
cnf_matrix = confusion_matrix(y_test, y_pred)

# Create heatmap from the confusion matrix
%matplotlib inline
class_names=[False, True] # name  of classes
fig, ax = plt.subplots(figsize=(7, 6))
sns.heatmap(pd.DataFrame(cnf_matrix), annot=True, cmap="YlGnBu", fmt='g')
ax.xaxis.set_label_position("top")
plt.tight_layout()
plt.title('Confusion matrix')
plt.ylabel('Actual label')
plt.xlabel('Predicted label')
tick_marks = [0.5, 1.5]
plt.xticks(tick_marks, class_names)
plt.yticks(tick_marks, class_names)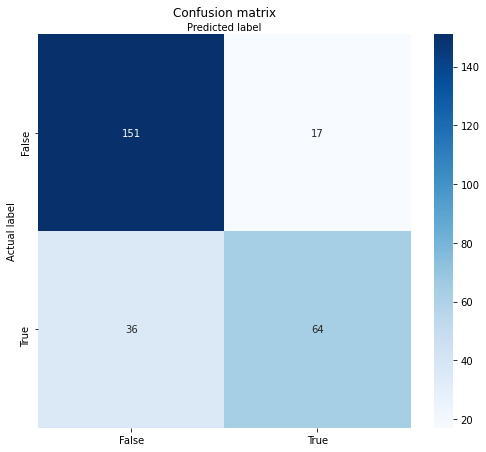
Confusion matrix of the best-guess random forest model
Our best-guess model accurately predicted that 151 passengers would not survive. The dark-blue number in the top-left is the group of titanic passengers that did not survive the sinking, and our model classified them correctly as non-survivors. The green area below shows the passengers who survived the sinking and were correctly classified. The other sections show the number of times our model was wrong.
In total, these results correspond to a model accuracy of 80%. Considering that this was a best-guess model, these results are pretty good. However, we can further optimize these results by using the grid search approach for hyperparameter tuning.
Step #5 Hyperparameter Tuning a Classification Model using the Grid Search Technique
By comparing the performance of different model configurations, we can find the best set of hyperparameters that yields the highest accuracy. This approach is a powerful tool for fine-tuning machine learning models and improving their performance. So let’s get started and see if we can beat the results of our best-guess model using the grid search technique!
Training and Tuning the Model
Next, we will use the grid search technique to optimize a random decision forest model that predicts the survival of Titanic passengers. We’ll define a grid of hyperparameter values in Python and then use the Scikit-learn library to train and test the model with different hyperparameter configurations. First, we will define a parameter range:
- max_depth = [2, 8, 16]
- n_estimators = [64, 128, 256]
We leave the other parameters at their default value. In addition, we need to define against which metric we want the grid search algorithm to evaluate the model performance. Since we have no personal preference and our dataset is well-balanced, we choose the mean test score as the evaluation metric. Then we run the grid search algorithm.
# Define Parameters
max_depth=[2, 8, 16]
n_estimators = [64, 128, 256]
param_grid = dict(max_depth=max_depth, n_estimators=n_estimators)

# Build the grid search
dfrst = RandomForestClassifier(n_estimators=n_estimators, max_depth=max_depth)
grid = GridSearchCV(estimator=dfrst, param_grid=param_grid, cv = 5)
grid_results = grid.fit(x_train, y_train)

# Summarize the results in a readable format
print("Best: {0}, using {1}".format(grid_results.cv_results_['mean_test_score'], grid_results.best_params_))
results_df = pd.DataFrame(grid_results.cv_results_)
results_df
Best: [0.79611613 0.78005161 0.79290323 0.81387097 0.82187097 0.81867097
0.78818065 0.78816774 0.78498065], using {'max_depth': 8, 'n_estimators': 128}
mean_fit_time std_fit_time mean_score_time std_score_time param_max_depth param_n_estimators params split0_test_score split1_test_score split2_test_score split3_test_score split4_test_score mean_test_score std_test_score rank_test_score
0 0.057045 0.001108 0.005001 0.000001 2 64 {'max_depth': 2, 'n_estimators': 64} 0.824 0.800 0.784 0.774194 0.798387 0.796116 0.016883 4
1 0.112051 0.002088 0.009490 0.000775 2 128 {'max_depth': 2, 'n_estimators': 128} 0.760 0.824 0.784 0.750000 0.782258 0.780052 0.025523 9
2 0.221600 0.003740 0.016487 0.000448 2 256 {'max_depth': 2, 'n_estimators': 256} 0.792 0.824 0.784 0.774194 0.790323 0.792903 0.016756 5
3 0.061998 0.001410 0.005801 0.000400 8 64 {'max_depth': 8, 'n_estimators': 64} 0.784 0.824 0.792 0.806452 0.862903 0.813871 0.028044 3
4 0.122886 0.002652 0.009587 0.000480 8 128 {'max_depth': 8, 'n_estimators': 128} 0.784 0.848 0.808 0.806452 0.862903 0.821871 0.029089 1
5 0.250295 0.007654 0.018557 0.000836 8 256 {'max_depth': 8, 'n_estimators': 256} 0.800 0.824 0.800 0.806452 0.862903 0.818671 0.023797 2
6 0.065602 0.000505 0.005800 0.000399 16 64 {'max_depth': 16, 'n_estimators': 64} 0.736 0.808 0.784 0.766129 0.846774 0.788181 0.037557 6
7 0.127662 0.003297 0.008600 0.004080 16 128 {'max_depth': 16, 'n_estimators': 128} 0.752 0.800 0.784 0.758065 0.846774 0.788168 0.034078 7
8 0.259617 0.003121 0.018873 0.000537 16 256 {'max_depth': 16, 'n_estimators': 256} 0.752 0.784 0.776 0.766129 0.846774 0.784981 0.032690 8The list above is an overview of the tested model configurations, ranked by their prediction scores. Model number five achieved the best results. The parameters of this model are a maximum depth of 8 and several estimators of 256.
Model Evaluation
We select the best model and use it to predict the test data set. We visualize the results in another confusion matrix.
# Extract the best decision forest
best_clf = grid_results.best_estimator_
y_pred = best_clf.predict(x_test)

# Create a confusion matrix
cnf_matrix = confusion_matrix(y_test, y_pred)

# Create heatmap from the confusion matrix
%matplotlib inline
class_names=[False, True] # name  of classes
fig, ax = plt.subplots(figsize=(7, 6))
sns.heatmap(pd.DataFrame(cnf_matrix), annot=True, cmap="YlGnBu", fmt='g')
ax.xaxis.set_label_position("top")
plt.tight_layout()
plt.title('Confusion matrix')
plt.ylabel('Actual label')
plt.xlabel('Predicted label')
tick_marks = [0.5, 1.5]
plt.xticks(tick_marks, class_names)
plt.yticks(tick_marks, class_names)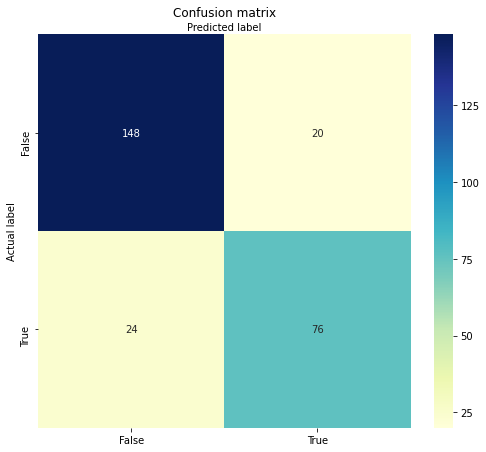
Confusion matrix of the best grid search model
The confusion matrix shows the best model results from the grid search technique. The result is an overall model accuracy of 83,5 %, which shows that the best grid search model outperforms our initial best guess model. This optimal model has correctly classified that 148 passengers would not survive and 76 passengers would survive. In 44 cases, the model was wrong.
Summary
This article has shown how we can use grid Search in Python to efficiently search for the optimal hyperparameter configuration of a machine learning model. In the conceptual part, you learned about hyperparameters and how to use grid search to try out all permutations of a predefined parameter grid.
In the hands-on part of this article, we developed a random decision forest that predicts the survival of Titanic passengers using Python and scikit-learn. The grid search technique applies not only to classification models but can also be used to optimize the performance of regression models. First, we developed a baseline model with best-guess parameters. Subsequently, we defined a parameter grid and used the grid search technique to tune the hyperparameters of the random decision forest. In this way, we quickly identified a configuration that outperforms our initial baseline model. In this way, we have demonstrated how Gid Search can help optimize the classification model parameters.
I hope this article was helpful. I am always interested to learn and improve. So, if you have any questions or suggestions, please write them in the comments.
Sources and Further Reading
The links above to Amazon are affiliate links. By buying through these links, you support the Relataly.com blog and help to cover the hosting costs. Using the links does not affect the price.


2 Commentsarchived from the original site