Correlation Matrix in Python: How Correlated are COVID-19 Cases and Different Financial Assets?

Correlation analysis is a powerful tool in financial market analysis, helping investors to better understand the interdependence of different assets. But what happens when an unprecedented global pandemic like COVID-19 shakes up the market? In this tutorial, we will show you how to create a correlation matrix in Python that will help you visualize the relationship between COVID-19 and various financial assets.
First, we will delve into the nitty-gritty of correlation coefficients and how to interpret them. We’ll focus specifically on the Pearson Correlation Coefficient, a popular measure used to quantify the strength of the relationship between two variables.
Next, we’ll dive right into the practical part of this tutorial and create a stock market correlation matrix in Python. Our matrix will measure the correlation between COVID-19 cases and various financial assets such as gold, Bitcoin, and other popular investments. With this matrix, investors can identify the extent to which COVID-19 has impacted different asset classes and make more informed investment decisions.
Whether you’re a seasoned investor or just starting out, this tutorial will equip you with the knowledge and tools you need to analyze the correlation between COVID-19 and financial markets. So, let’s dive in and start exploring the fascinating world of correlation analysis!
Also: Color-coded Cryptocurrency Price Charts with Python
A correlation matrix, as we will create it in this article.
Different Types of Correlation Coefficients
There are various types of correlation coefficients used to measure the strength and direction of the relationship between two variables. The most common is the Pearson correlation coefficient, which measures the linear relationship between two variables. This is the correlation coefficient on which we will focus in this article. However, if the relationship between two variables is more complex, other coefficients are a better choice for the analysis.
For example, in situations where the data is not normally distributed or when there are outliers, the Spearman correlation coefficient is used. This coefficient measures the relationship between two variables using ranks instead of the actual data. It is also known as the rank correlation coefficient. For ordinal data, the Kendall correlation coefficient is used. This coefficient measures the strength and direction of the relationship between two variables, taking into account the order of the data points. Finally, the Point-Biserial and Biserial correlation coefficients are used when one variable is dichotomous and the other is continuous. These coefficients measure the strength and direction of the relationship between these variables.
Let’s take a closer look at Pearson Correlation.
Pearson Correlation
The Pearson correlation coefficient r is a standard measure for quantifying a linear relationship between two variables. In other words, r is a measure of how strongly two continuous variables (for example, price or volume) tend to make similar changes. For the Pearson correlation coefficient to return a meaningful value, the following conditions must be met:
- Both variables, x and y, are metrically scaled and continuous.
- The relationship between the two variables is approximately linear.
- The two samples of the variables x and y are independent of each other.
Correlation measures how much two variables are associated. The Pearson correlation is calculated by dividing the covariance of two variables (x, y) by their standard deviations.
Interpreting the Pearson Correlation Coefficient
The value of r is restricted to the range between 1 and -1. Interpreting r requires us to differentiate the following cases:
- The closer r is to 1, the stronger the relationship is, and the better the points (Xi / Yi) fit on the regression line.
- The closer r is to 0, the weaker the correlation is, and the more widely are the points spread around the regression line.
- The extreme cases r = 1 or r = -1 result from a functional relation, defined by a linear equation of y = a + b*x can be described exactly. In this case, all points (xi / Yi) is located on the regression line.

Graphical representation of different correlation coefficients
Be aware that the correlation coefficient is often subject to misinterpretation. For example, an empirical correlation coefficient whose value is > 0 merely states that we can prove a relation based on a sample. However, it does not explain why this relationship exists. In addition, if r ~ 0 does not mean that the two variables are independent. Instead, it only means that we cannot prove a linear relation.
Implementing a Correlation Matrix in Python
In the following, we’ll dig deep into the data and analyze the spread of COVID-19 cases and casualties. To create this correlation matrix, we’ll utilize the Pandas library, a fantastic tool for data analysis that enables us to work with data in a variety of formats.
First, we’ll load our data into a Pandas DataFrame, allowing us to manipulate and calculate correlations with ease. We’ll then use the corr() method to compute the correlation coefficients between the different asset classes and COVID-19. This generates a matrix that provides a clear view of the correlations between our variables.
To make this information more visually appealing, we’ll create a heatmap using the Seaborn library. This heatmap will enable us to easily identify which asset classes are strongly correlated with COVID-19 and which are not.
By creating a correlation matrix in Python, we can gain invaluable insights into the relationship between COVID-19 and the financial market. This knowledge can help us make informed investment decisions by identifying patterns and trends. So let’s dive in and create a correlation matrix that reveals the connection between COVID-19 and the financial market!
The code is available on the GitHub repository.
Prerequisites
Before starting the coding part, make sure that you have set up your Python 3 environment and required packages. If you don’t have an environment set up yet, you can follow this tutorial to set up the Anaconda environment. Also, make sure you install all required packages. In this tutorial, we will be working with the following standard packages:
In addition, we will be using the pandas-DataReader package and Seaborn for visualization. You can install packages using console commands:
pip install <package name>
conda install <package name> (if you are using the anaconda packet manager)
Step #1 Load Data
We begin by loading data about historic COVID-19 cases and price Information on different financial assets.
1.1 Load Historic COVID-19 Data
We begin by downloading the COVID-19 data. For this purpose, we will use the Statworx API. It provides historical time series data on the number of COVID-19 cases in different countries. In addition, the data contains the number of casualties. If you are not yet familiar with APIs, consider my recent tutorial on working with APIs in Python.
# A tutorial for this file is available at www.relataly.com

# Imports
import pandas as pd
import pandas_datareader as web
import numpy as np
from datetime import datetime
import seaborn as sns
from matplotlib import pyplot as plt
import matplotlib.dates as mdates
import requests
import json
from pandas.plotting import register_matplotlib_converters

# Load second Dataset with Corona Cases
payload = {"code": "ALL"}
URL = "https://api.statworx.com/covid"
response = requests.post(url=URL, data=json.dumps(payload))
df_covid = pd.DataFrame.from_dict(json.loads(response.text))
# df_covid = df_covid[df_covid['code'] == 'US']

# Add the date column as variable
df_covid["Date"] = pd.to_datetime(df_covid["date"])

# Delete some columns that we won't use
df_covid.drop(
    ["day", "month", "year", "country", "code", "population", "date"],
    axis=1,
    inplace=True,
)

# Summarize cases over all countries
df_covid = df_covid.groupby(["Date"]).sum()
df_covid.head()
cases deaths cases_cum deaths_cum
Date
2019-12-31 27 0 27 0
2020-01-01 0 0 27 0
2020-01-02 0 0 27 0
2020-01-03 17 0 44 0
2020-01-04 0 0 44 01.2 Loading Data on Selected Financial Assets
We continue by downloading historical price data on different financial assets. For this purpose, we use the Yahoo Finance API. We limit the period to the time after the first documented COVID-19 cases. When you execute the code of this tutorial as it is, you will receive price information for the following financial assets:
Stock Market Indexes
- S&P500
- DAX
- Niki
- N225
- S&P500 Futures
Stocks: Online Services
- Amazon
- Netflix
- Apple
- Microsoft
Stocks: Airlines
- Lufthansa Stock
- American Airlines
Resource Futures
- Crude Oil Price
- Gold
- Soybean Price
Treasury Bonds Futures
- US Treasury Bonds
Exchange Rates
- EUR-USD
- CHF-EUR
- GBP-USD
- GBP-EUR
Crypto Currencies
- BTC-USD
- ETH-USD
Be aware that stock symbols can change from time to time. If the API does not find a specific stock symbol, you have to look up the current Symbol on Yahoo Finance.
df_covid_new = df_covid.copy()

# Read the data for different assets
today_date = datetime.today().strftime("%Y-%m-%d")
start_date = "2020-01-01"
asset_dict = {
    "^GSPC": "SP500",
    "DAX": "DAX",
    "^N225": "N225",
    "ES=F": "SP500FutJune20",
    "LHA.DE": "Lufthansa",
    "AAL": "AmericanAirlines",
    "NFLX": "Netflix",
    "AMZN": "Amazon",
    "AAPL": "Apple",
    "MSFT": "Microsoft",
    "GOOG": "Google",
    "BTC-USD": "BTCUSD",
    "ETH-USD": "ETHUSD",
    "CL=F": "Oil",
    "GC=F": "Gold",
    #"SM=F": "Soybean",
    "ZB=F": "UsTreasuryBond",
    "GBPEUR=X": "GBPEUR",
    "EURUSD=X": "EURUSD",
    "CHFEUR=X": "CHFEUR",
    "GBPUSD=X": "GBPUSD"}

col_list = []
# Join the dataframes
for key, value in asset_dict.items():
    print(key, value)
    try:
        df_temp = web.DataReader(
            key, start=start_date, end=today_date, data_source="yahoo")
    except ValueError:
        print(f' {key} symbol not found')
    # convert index to Date Format
    df_temp.index = pd.to_datetime(df_temp.index)
    df_temp.rename(columns={"Close": value}, inplace=True) # Rename Close Column
    df_covid_new = pd.merge(
        left=df_covid_new,
        right=df_temp[value],
        how="inner",
        left_index=True, right_index=True)

df_covid_new.head()
cases deaths cases_cum deaths_cum SP500 DAX N225 SP500FutJune20 Lufthansa AmericanAirlines ... Google BTCUSD ETHUSD Oil Gold UsTreasuryBond GBPEUR EURUSD CHFEUR GBPUSD
Date
2020-01-06 0 0 59 0 3246.280029 28.004999 23204.859375 3243.50 15.340 27.320000 ... 1394.209961 7769.219238 144.304153 63.270000 1566.199951 157.84375 1.17169 1.116196 0.922110 1.308010
2020-01-07 0 0 59 0 3237.179932 27.955000 23575.720703 3235.25 15.365 27.219999 ... 1393.339966 8163.692383 143.543991 62.700001 1571.800049 157.40625 1.17635 1.119799 0.922212 1.317003
2020-01-08 0 0 59 0 3253.050049 28.260000 23204.759766 3260.25 15.540 27.840000 ... 1404.319946 8079.862793 141.258133 59.610001 1557.400024 156.37500 1.17551 1.115474 0.925181 1.311372
2020-01-09 0 0 59 0 3274.699951 28.450001 23739.869141 3276.00 16.160 27.950001 ... 1419.829956 7879.071289 138.979202 59.560001 1551.699951 156.81250 1.17912 1.111321 0.924505 1.310513
2020-01-10 0 0 59 0 3265.350098 28.500000 23850.570312 3264.75 15.815 27.320000 ... 1429.729980 8166.554199 143.963776 59.040001 1557.500000 157.62500 1.17620 1.111111 0.924796 1.307019
5 rows × 24 columnsYou can add assets of your choice to the asset list if you want. You can find the respective symbols on finance.yahoo.com.
Step #2 Exploring the Data
Next, we will visualize the historical data using line charts.
# Create lineplots
list_length = df_covid_new.shape[1]
ncols = 6
nrows = int(round(list_length / ncols, 0))
height = list_length/3 if list_length > 30 else 16

fig, axs = plt.subplots(nrows=nrows, ncols=ncols, sharex=True, figsize=(20, height))

for i, ax in enumerate(fig.axes):
        if i < list_length:
            sns.lineplot(data=df_covid_new, x=df_covid_new.index, y=df_covid_new.iloc[:, i], ax=ax)
            ax.set_title(df_covid_new.columns[i])
            ax.tick_params(labelrotation=45)

plt.show()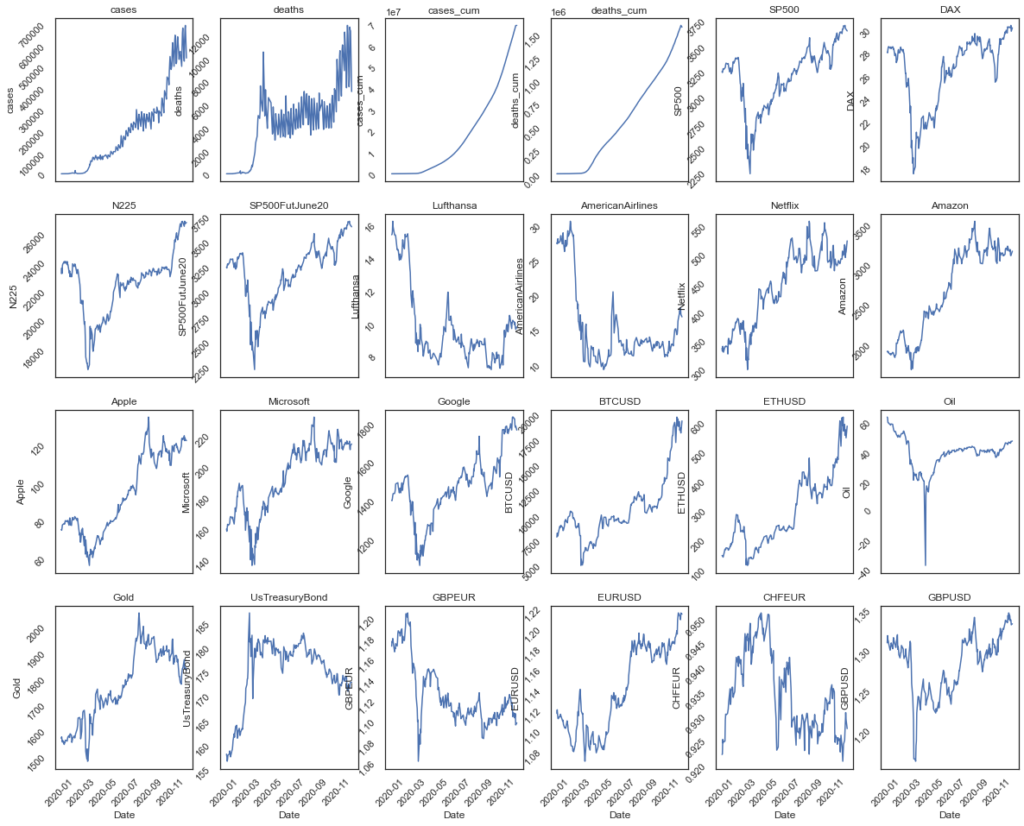
We can easily spot pairs that seem to have experienced similar price developments. This does not mean, however, that these pairs are correlated.
Step #3 Correlation Matrix
Next, we will calculate the correlation matrix. Various Python libraries make this an easy task that only requires a few lines of code. We will use the standard math package for this purpose.
# Plotting a diagonal correlation matrix
sns.set(style="white")

# Compute the correlation matrix
df = pd.DataFrame(df_covid_new, columns=col_list)
corr = df_covid_new.corr()
corr
cases deaths cases_cum deaths_cum SP500 DAX N225 SP500FutJune20 Lufthansa AmericanAirlines ... Google BTCUSD ETHUSD Oil Gold UsTreasuryBond GBPEUR EURUSD CHFEUR GBPUSD
cases 1.000000 0.853512 0.972691 0.966481 0.663638 0.519676 0.660547 0.659832 -0.451801 -0.413463 ... 0.796671 0.898456 0.899876 0.073393 0.719520 0.147347 -0.566227 0.843788 -0.538949 0.513913
deaths 0.853512 1.000000 0.778833 0.804270 0.399756 0.259080 0.400126 0.395697 -0.590251 -0.589090 ... 0.567708 0.705201 0.718329 -0.228573 0.664476 0.399694 -0.574079 0.628463 -0.291254 0.245614
cases_cum 0.972691 0.778833 1.000000 0.974553 0.714616 0.571317 0.711905 0.711552 -0.379420 -0.325739 ... 0.812816 0.922179 0.932026 0.142586 0.682001 0.059693 -0.516654 0.865846 -0.584541 0.584691
deaths_cum 0.966481 0.804270 0.974553 1.000000 0.712595 0.587606 0.681964 0.709312 -0.498761 -0.441631 ... 0.808086 0.875724 0.925765 0.097746 0.805602 0.193165 -0.626253 0.902159 -0.603867 0.529622
SP500 0.663638 0.399756 0.714616 0.712595 1.000000 0.960100 0.956142 0.999766 0.140961 0.205127 ... 0.944084 0.806056 0.801970 0.623960 0.553991 -0.359058 -0.043646 0.738902 -0.791377 0.853893
DAX 0.519676 0.259080 0.571317 0.587606 0.960100 1.000000 0.934535 0.960816 0.246646 0.304234 ... 0.860881 0.678125 0.688038 0.715992 0.500840 -0.387279 -0.002362 0.685518 -0.844509 0.826270
N225 0.660547 0.400126 0.711905 0.681964 0.956142 0.934535 1.000000 0.956710 0.240638 0.281306 ... 0.922091 0.829050 0.761729 0.655562 0.425364 -0.436453 -0.005655 0.673853 -0.790071 0.810057
SP500FutJune20 0.659832 0.395697 0.711552 0.709312 0.999766 0.960816 0.956710 1.000000 0.147155 0.211133 ... 0.943475 0.804529 0.799886 0.627447 0.549565 -0.363198 -0.039701 0.736997 -0.792258 0.855152
Lufthansa -0.451801 -0.590251 -0.379420 -0.498761 0.140961 0.246646 0.240638 0.147155 1.000000 0.964624 ... -0.006089 -0.135931 -0.296115 0.629831 -0.665533 -0.853762 0.815127 -0.388975 -0.107357 0.262015
AmericanAirlines -0.413463 -0.589090 -0.325739 -0.441631 0.205127 0.304234 0.281306 0.211133 0.964624 1.000000 ... 0.026610 -0.115151 -0.245080 0.658176 -0.603162 -0.877327 0.790366 -0.312451 -0.143469 0.330665
Netflix 0.750950 0.701806 0.721492 0.840104 0.601819 0.523924 0.493603 0.596449 -0.637187 -0.578967 ... 0.672056 0.614683 0.749042 -0.027917 0.914606 0.438247 -0.652950 0.766065 -0.460004 0.338608
Amazon 0.801935 0.710040 0.776041 0.887487 0.669833 0.597223 0.564001 0.665996 -0.591990 -0.528531 ... 0.732905 0.672651 0.809639 0.049571 0.936733 0.365580 -0.664869 0.848771 -0.562987 0.428907
Apple 0.840178 0.631516 0.862322 0.917166 0.843786 0.765495 0.750124 0.841533 -0.357089 -0.275023 ... 0.860493 0.800416 0.906042 0.295665 0.851025 0.081060 -0.499164 0.927081 -0.719334 0.673724
Microsoft 0.772067 0.647593 0.751721 0.849898 0.792196 0.723458 0.689305 0.788468 -0.416892 -0.354098 ... 0.833358 0.723236 0.819949 0.206249 0.871319 0.209342 -0.496853 0.807662 -0.598330 0.529434
Google 0.796671 0.567708 0.812816 0.808086 0.944084 0.860881 0.922091 0.943475 -0.006089 0.026610 ... 1.000000 0.902355 0.866670 0.492750 0.593879 -0.219884 -0.174525 0.765421 -0.713271 0.770065
BTCUSD 0.898456 0.705201 0.922179 0.875724 0.806056 0.678125 0.829050 0.804529 -0.135931 -0.115151 ... 0.902355 1.000000 0.942019 0.315591 0.568836 -0.099474 -0.285379 0.777073 -0.620303 0.685506
ETHUSD 0.899876 0.718329 0.932026 0.925765 0.801970 0.688038 0.761729 0.799886 -0.296115 -0.245080 ... 0.866670 0.942019 1.000000 0.242502 0.740186 0.068097 -0.419289 0.886153 -0.644605 0.696074
Oil 0.073393 -0.228573 0.142586 0.097746 0.623960 0.715992 0.655562 0.627447 0.629831 0.658176 ... 0.492750 0.315591 0.242502 1.000000 -0.035808 -0.685471 0.344647 0.261168 -0.615400 0.626496
Gold 0.719520 0.664476 0.682001 0.805602 0.553991 0.500840 0.425364 0.549565 -0.665533 -0.603162 ... 0.593879 0.568836 0.740186 -0.035808 1.000000 0.485554 -0.672429 0.815864 -0.489188 0.381673
UsTreasuryBond 0.147347 0.399694 0.059693 0.193165 -0.359058 -0.387279 -0.436453 -0.363198 -0.853762 -0.877327 ... -0.219884 -0.099474 0.068097 -0.685471 0.485554 1.000000 -0.667468 0.154001 0.278546 -0.412731
GBPEUR -0.566227 -0.574079 -0.516654 -0.626253 -0.043646 -0.002362 -0.005655 -0.039701 0.815127 0.790366 ... -0.174525 -0.285379 -0.419289 0.344647 -0.672429 -0.667468 1.000000 -0.586152 0.230223 0.187170
EURUSD 0.843788 0.628463 0.865846 0.902159 0.738902 0.685518 0.673853 0.736997 -0.388975 -0.312451 ... 0.765421 0.777073 0.886153 0.261168 0.815864 0.154001 -0.586152 1.000000 -0.756216 0.686032
CHFEUR -0.538949 -0.291254 -0.584541 -0.603867 -0.791377 -0.844509 -0.790071 -0.792258 -0.107357 -0.143469 ... -0.713271 -0.620303 -0.644605 -0.615400 -0.489188 0.278546 0.230223 -0.756216 1.000000 -0.711504
GBPUSD 0.513913 0.245614 0.584691 0.529622 0.853893 0.826270 0.810057 0.855152 0.262015 0.330665 ... 0.770065 0.685506 0.696074 0.626496 0.381673 -0.412731 0.187170 0.686032 -0.711504 1.000000
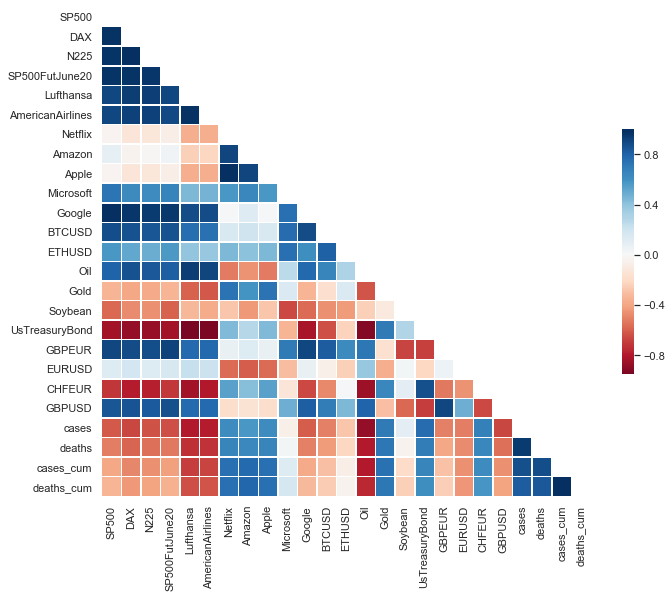
24 rows × 24 columnsThe matrix shows the Pearson correlation coefficients of all the pairs (X, Y) in our dataset.
Step #4 Visualizing the Correlation Matrix in a Heatmap
Heatmaps are an excellent choice for visualizing a correlation matrix. The heatmap applies a color palette to represent numeric values on a scale in different colors. This makes it easier to capture differences and similarities among the correlation coefficients. In Python, we can create heatmaps using the Seaborn package.
# Generate a mask for the upper triangle
mask = np.triu(np.ones_like(corr, dtype=np.bool))

# Set up the matplotlib figure
f, ax = plt.subplots(figsize=(11, 9))

# Generate a custom diverging colormap
cmap = "RdBu"

# Draw the heatmap with the mask and correct aspect ratio
sns.heatmap(
    corr,
    mask=mask,
    cmap=cmap,
    center=0,
    square=True,
    linewidths=0.5,
    cbar_kws={"shrink": 0.5},
)
Visualization of the Correlation Matrix in the form of a Heatmap
The correlation matrix is symmetric. This is because the correlation between a pair of variables X and Y is the same as between Y and X.
Step #5 Interpretation
The heatmap uses a color palette that ranges from blue (positive correlation) over white (no correlation) to red (negative correlation). The different shades of the three colors visualize the extent of the correlation. We can distinguish between correlated pairs, uncorrelated pairs, and negatively correlated pairs. We will compare the different asset classes step by step in the following.
5.1 Stock Market Indices / COVID-19
Let us start with the pairs of Stock market indices and COVID-19 data. The heatmap signals a negative correlation between the indices (DAX, S&P500, NIKI) and COVID-19. In other words, when the number of cases rises, stock market indices tend to fall in value. If we look precisely, the total number of new cases seems more correlated than the number of cases (cases_cum) or deaths (deaths_cum). In addition, one can observe that the stock market indices are correlated.
5.2 Stock Market Indices / Online Service Provider Stocks
The situation is heterogeneous when we compare the stock markets with the shares of online service providers. There is a positive correlation between the shares of Microsoft and Google and the overall development of the markets. On the other hand, the shares of Netflix, Amazon, and Apple are hardly correlated with market development.
5.3 Stock Market Indices / Airline Stocks
Airlines are heavily affected by the pandemic. Thus it is plausible that we observe a strong positive correlation between airline stocks and the general stock market indices.
5.4 Stock Market Indices / Crypto-Currencies
Next, we compare Cryptocurrencies with the stock market indices. The results are surprising. BTC-USD correlates surprisingly strong positive with the general development of the stock markets. However, the correlation is only slightly positive for ETH-USD and the markets.
5.5 COVID-19 / Currency Exchange Rates
The correlation between exchange rates and COVID-19 cases is relatively weak. Only GBP/EUR, EUR/USD, and GBP/USD show a slightly negative correlation. An exception is CHF/EUR, which positively correlates to the number of COVID-19 cases.
5.6 Treasury Bonds / Resources
Looking at the coefficients of resources and US Treasury Bonds, we can observe a strong negative correlation between COVID-19 cases and the oil price and a strong positive correlation with the gold price.
5.7 Crypto-Currencies / Resources
Finally, let us consider the coefficients of resources and cryptocurrencies. It is noticeable that BTCUSD correlates with the oil price. Based on the absence of a correlation with gold, one might conclude that BTC-USD is not a comparable crisis currency. However, the correlation between market indices and cryptocurrencies such as ETH-USD is relatively low. Thus, they were less affected by the recent market slump.
Also: Stock Market Prediction using Multivariate Data
Summary
Congratulation, you have reached the end of this tutorial! In this article, we have load data on COVID-19 and financial assets via an API. We have created a correlation matrix in Python that shows the linear correlation between financial assets and COVID-19 cases. Finally, we have visualized the matrix in a heatmap and concluded the correlation of different asset pairs. However, we must remember that we may still be unaware of potential non-linear correlations.
Please show your appreciation by leaving a like or comment if you found this article helpful.
And if you are interested to learn more about an advanced use case for correlation analysis, please take a look at this article on clustering cryptocurrencies.
Sources and Further Reading
- YouTube tutorial that explains the math behind the correlation
- Andriy Burkov (2020) Machine Learning Engineering
- Uncover Hidden Patterns in Financial Markets using Affinity Propagation Clustering in Python
Images created with Midjourney.


3 Commentsarchived from the original site