Univariate Stock Market Forecasting using Facebook Prophet in Python

Have you ever wondered how Facebook predicts the future? Meet Facebook Prophet, the open-source time series forecasting tool developed by Facebook’s Core Data Science team. Built on top of the PyStan library, Facebook Prophet offers a simple and intuitive interface for creating forecasts using historical data. What sets Facebook Prophet apart is its highly modular design, allowing for a range of customizable components that can be combined to create a wide variety of forecasting models. This makes it perfect for modeling data with strong seasonal effects, like daily or weekly patterns, and it can handle missing data and outliers with ease. In this tutorial, we will take a closer look at the capabilities of Facebook Prophet and see how it can be used to make accurate predictions.
We begin with a brief discussion of how the Facebook Prophet decomposes a time series into different components. Then we turn to the hands-on part. you can use its model in Python to generate a stock market forecast. We will train our Facebook Prophet model using the historical price of the Coca-Cola stock. We will also cover different options to customize the model settings.
Disclaimer: This article does not constitute financial advice. Stock markets can be very volatile and are generally difficult to predict. Predictive models and other forms of analytics applied in this article only illustrate machine learning use cases.

Facebook Prophet - an open-source tool for time series forecasting
What is Facebook Prophet?
Facebook Prophet is a tool that can be used to make predictions about future events based on historical data. It was developed by Taylor and Letham, 2017, who later made it available as an open-source project. The authors developed Facebook Prophet to solve various business forecasting problems without requiring much prior knowledge. In this way, the framework addresses a significant problem many companies face today. They have various prediction problems (e.g., capacity and demand forecasting) but face a skill gap when it comes to generating reliable forecasts with techniques such as ARIMA or neural networks. Compared to that, Facebook Prophet requires minimal fine-tuning and can deal with various challenges, including seasonality, outliers, and changing trend lines. This allows Facebook Prophet to handle a wide range of forecasting problems flexibly. Before we dive into the hands-on part, let’s gain a quick overview of how Facebook Prophet works.
Also: Stock Market Prediction using Multivariate Time Series

Time-series forecasting with Facebook Prophet. Image generated with Midjourney.
How Facebook Prophet Works
Facebook Prophet uses a technique called additive regression to model time series data. This involves breaking the time series into a series of components:
- Trends
- Seasonality
- Holiday
Traditional time series methods such as (S)ARIMA base their prediction on a model that weights the linear sum of past observations or lags. Facebook’s Prophet is similar in that it uses a decreasing weight for past observations. This means current observations have a higher significance for the model than those that date back a long time. It then models each component separately using a combination of linear and non-linear functions. Finally, Facebook Prophet combines these components to form the complete forecast model. Let’s take a closer look at these components and how Facebook Prophet handles them.
A) Dealing with Trends
Time series often have a trendline. However, even more often, a time series will not follow a single trend, but it has several trend components that are separated by breakpoints. Facebook Prophet tries to handle these trends in several ways. First, the model tries to identify the breakpoints (knots) in a time series that divide different periods. Each breakpoint separates two periods with different trendlines. Facebook Prophet then uses these inflection points between periods to fit the model to the data and create the forecast. In addition, trendlines do not have to be linear but can also be logarithmic. This is all done automatically, but it is also possible to specify breakpoints manually.
B) Seasonality
Facebook Prophet works very well when the data shows a strong seasonal pattern. It uses Fourier transformations (adding different sine and cosine frequencies) to account for daily, weekly and yearly seasonality. The Facebook Prophet model is flexible on the type of data you have by allowing you to adjust the seasonal components of your data. By default, Facebook Prophet assumes daily data with weekly and yearly seasonal effects. If your data differentiates from this standard, for example, you have weekly data with monthly seasonality, then you need to adjust the number of terms accordingly.
C) Holiday
Every year, public holidays can lead to strong deviations in a time series; for example, thinking of computing power, demand more people will visit the Facebook website. The Facebook Prophet model also accounts for such special events by allowing us to specify binary indicators that mark whether a certain day is a public holiday. If you have other non-holiday events that occur yearly, you can use this indicator for the same purpose. Usually, Facebook Prophet will automatically remove outliers from the data. But if an outlier occurs on a day highlighted as a public holiday, Facebook Prophet will adjust its model accordingly.
Hyperparameter Tuning and Customization
Facebook Prophet includes additional optimization techniques, such as Bayesian optimization, to automatically tune the model’s hyperparameters, such as the length of the seasonal period, to improve its accuracy. Once the model is trained, it can be used to predict future values in the time series. However, users with a strong domain knowledge may prefer to tweak these parameters themselves, and Facebook Prophet provides several functions for this purpose. It also includes a range of tools for model evaluation and diagnostics, as well as for visualizing the model and the input data.
Also: Using Random Search to Tune the Hyperparameters of a Random Decision Forest with Python
Application Domains
Facebook Prophet is a powerful forecasting tool that has been specifically designed to make forecasting easy. As mentioned, Prophet is easy to use and can flexibly handle various forecasting problems. In addition, it requires very little preprocessing to generate accurate forecasts. As a result of these advantages, Facebook Prophet has been adopted by various application domains. Some possible application domains for Facebook Prophet include:
- Sales forecasting: Facebook Prophet can be used to predict future sales of a product or service, based on historical sales data. This can be useful for businesses to plan their inventory and staffing, and to make informed decisions about future investments and growth.
- Financial forecasting: Facebook Prophet can be used to predict future stock prices, currency exchange rates, or other financial metrics. This can be useful for investors and financial analysts to make informed decisions about the market.
- Traffic forecasting: Facebook Prophet can be used to predict future traffic on a website or mobile app based on historical data. This can be useful for businesses to plan for capacity and optimize their servers and infrastructure.
- Energy consumption forecasting: Facebook Prophet can be used to predict future energy consumption based on historical data. This can be useful for utilities and energy companies to plan for demand and optimize their generation and distribution.
When to Use Facebook Prophet?
Although Facebook Prophet is applicable in any domain where time series data is available, it is most effective when certain conditions are met. These include univariate time series data with prominent seasonal effects and an extensive historical record spanning multiple seasons. Facebook Prophet is especially beneficial when dealing with large quantities of historical data that require efficient analysis and quick, accurate predictions of future trends.
Also: Rolling Time Series Forecasting: Creating a Multi-Step Prediction
Using Facebook Prophet to Forecast the Coca-Cola Stock Price in Python
In this hands-on tutorial, we’ll use Facebook Prophet and Python to create a forecast for the Coca-Cola stock price. We have chosen Coca-Cola as an example because the Coca-Cola share is known to be a cyclical stock. As such, its chart reflects a seasonal pattern, different periods, and varying trend lines. We train our model on historical price data and then predict the next data points half-year in advance. In addition, we will discuss how we could finetune our model to improve the accuracy of the predictions further. This involves the following steps:
- Collect historical stock data for CocaCola and familiarize ourselves with the data.
- Use Facebook Prophet to fit a model to the data.
- Use the model to make predictions about the future stock price of Coca-Cola.
- Visualize model components and predictions.
- Manually adjust the model to improve the model fit.
By following these steps, we will try to gain insights into the future performance of Coca-Cola stock. Let’s get started!
As always, you can find the code of this tutorial on the GitHub repository.
Prerequisites
Before you proceed, ensure that you have set up your Python environment (3.8 or higher) and the required packages. If you don’t have an environment, consider following this tutorial to set up the Anaconda environment.
Also, make sure you install all required Python packages. We will be working with the following standard Python packages:
- pandas
- seaborn
- matplotlib
In addition, we will use the Facebook Prophet library that goes by the library name “prophet.” You can install these packages using the following commands:
pip install <package name>
conda install <package name> (if you are using the anaconda packet manager)
Step #1 Loading Packages and API Key
Let’s begin by loading the required Python packages and historical price quotes for the Coca-Cola stock. We will obtain the data from the yahoo finance API. Note that the API will return several columns of data, including, opening, average, and closing prices. We will only use the closing price.
# Tested with Python 3.8.8, Matplotlib 3.5, Seaborn 0.11.1, numpy 1.19.5, plotly 4.1.1, cufflinks 0.17.3, prophet 1.1.1, CmdStan 2.31.0
import pandas as pd
import matplotlib.pyplot as plt
import numpy as np
from math import log, exp
from datetime import date, timedelta, datetime
import seaborn as sns
sns.set_style('white', {'axes.spines.right': False, 'axes.spines.top': False})
from scipy.stats import norm
from prophet import Prophet
from prophet.plot import add_changepoints_to_plot
import cmdstanpy
cmdstanpy.install_cmdstan()
cmdstanpy.install_cmdstan(compiler=True)
# Setting the timeframe for the data extraction
end_date =  date.today().strftime("%Y-%m-%d")
start_date = '2010-01-01'
# Getting quotes
stockname = 'Coca Cola'
symbol = 'KO'
# You can either use webreader or yfinance to load the data from yahoo finance
# import pandas_datareader as webreader
# df = webreader.DataReader(symbol, start=start_date, end=end_date, data_source="yahoo")
import yfinance as yf #Alternative package if webreader does not work: pip install yfinance
df = yf.download(symbol, start=start_date, end=end_date)
# Quick overview of dataset
print(df.head())
[*********************100%***********************] 1 of 1 completed
Open High Low Close Adj Close Volume
Date
2010-01-04 28.580000 28.610001 28.450001 28.520000 19.081614 13870400
2010-01-05 28.424999 28.495001 28.070000 28.174999 18.850786 23172400
2010-01-06 28.174999 28.219999 27.990000 28.165001 18.844103 19264600
2010-01-07 28.165001 28.184999 27.875000 28.094999 18.797268 13234600
2010-01-08 27.730000 27.820000 27.375000 27.575001 18.449350 28712400Once we have downloaded the data, we create a line plot of the closing price to familiarize ourselves with the time series data. Note that Facebook Prophet works on a single input signal only (univariate data). This input will be the closing price. For illustration purposes, we add a moving average to the chart. However, the moving average makes it easier to spot trends and seasonal patterns, it will not be used to fit the model.
# Visualize the original time series
rolling_window=25
y_a_add_ma = df['Close'].rolling(window=rolling_window).mean()
fig, ax = plt.subplots(figsize=(20,5))
sns.lineplot(data=df, x=df.index, y='Close', color='skyblue', linewidth=0.5, label='Close')
sns.lineplot(data=df, x=df.index, y=y_a_add_ma,
    linewidth=1.0, color='royalblue', linestyle='--', label=f'{rolling_window}-Day MA')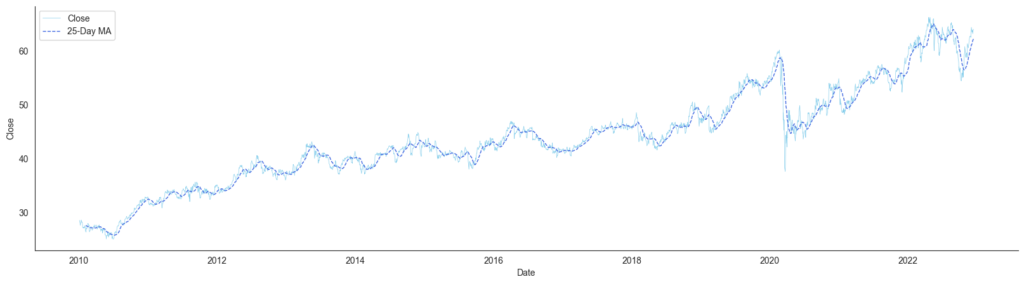
The chart shows a long-term upward trend interrupted by phases of downturns. In addition, between 2010 and 2018, we can see some cyclical movements. At some points, we can spot clear breakpoints, for example, in 2019 and mid-2020.
Step #2 Preparing the Data
Next, we prepare our data for model training. Propjet has a strict condition on how the input columns must be named. In order to use Facebook Prophet, your data needs to be in a time series format with the time as the index and the value as the first column. In addition, column names need to adhere to the following naming convention:
- ds for the timestamp
- y for the metric columns, which in our case is the closing price
So before we proceed, we must rename the columns in our dataframe. In addition, we will remove the index and drop NA values.
df_x = df[['Close']].copy()
df_x['ds'] = df.index.copy()
df_x.rename(columns={'Close': 'y'}, inplace=True)
df_x.reset_index(inplace=True, drop=True)
df_x.dropna(inplace=True)
df_x.tail(9)
y ds
3257 63.139999 2022-12-09
3258 63.970001 2022-12-12
3259 63.990002 2022-12-13Now we have a simple dataframe with ds and y as the only variables.
Step #3 Model Fitting and Forecasting
Next, let’s fit our forecasting model to the time series data. Afterward, we can make predictions about future values in the series. However, before we do this, we need to define our prediction interval.
3.1 Setting the Prediction Interval
The prediction interval is a measure of uncertainty in a forecast made with Facebook Prophet. It indicates the range within which the true value of the forecasted quantity is expected to fall a certain percentage of the time. For example, a 95% prediction interval means that the true value of the forecasted quantity is expected to fall within the given range 95% of the time.
In Facebook Prophet, the prediction interval is controlled by the interval_width parameter, which can be set when calling the predict method. The default value for interval_width is 0.80. This means that the true value of the forecasted quantity is expected to fall within the prediction interval 80% of the time. We can adjust the value of interval_width to change the width of the prediction interval as desired. In the example below, we use a prediction interval of 0.85.
3.2 Fit the Model
Next, let’s fit our model and generate a one-year forecast. First, we need to instantiate our model with by calling Prophet(). Then we use model.fit(df) to fit this model to the historical price quotes of the Coca-Cola stock. Once, we have done that, we use the model instance model.make_future_dataframe() to create an extended dataframe (future_df). This dataframe has been extended with records for a one-year period. The records are empty dummy values ready to be filled with the real forecast. We then pass this dummy dataframe to the model.predict(df) function, Facebook Prophet creates the forecast and fills up the dummy dataframe with the forecast values.
For the sake of reusability, I have encapsulated the entire process into a wrapper function. This will allow us to run quick experiments with different parameter values.
# This function fits the prophet model to the input data and generates a forecast
def fit_and_forecast(df, periods, interval_width, changepoint_range=0.8):
    # set the uncertainty interval
    Prophet(interval_width=interval_width)
    # Instantiate the model
    model = Prophet(changepoint_range=changepoint_range)
    # Fit the model
    model.fit(df)
    # Create a dataframe with a given number of dates
    future_df = model.make_future_dataframe(periods=periods)
    # Generate a forecast for the given dates
    forecast_df = model.predict(future_df)
    #print(forecast_df.head())
    return forecast_df, model, future_df
# Forecast for 365 days with full data
forecast_df, model, future_df = fit_and_forecast(df_x, 365, 0.95)
print(forecast_df.columns)
forecast_df[['yhat_lower', 'yhat_upper', 'yhat']].head(5)
Index(['ds', 'trend', 'yhat_lower', 'yhat_upper', 'trend_lower', 'trend_upper',
'additive_terms', 'additive_terms_lower', 'additive_terms_upper',
'weekly', 'weekly_lower', 'weekly_upper', 'yearly', 'yearly_lower',
'yearly_upper', 'multiplicative_terms', 'multiplicative_terms_lower',
'multiplicative_terms_upper', 'yhat'],
dtype='object')
yhat_lower yhat_upper yhat
0 24.468273 28.944286 26.691615
1 24.496074 29.146425 26.706924
2 24.513424 28.829159 26.682213
3 24.358048 28.767209 26.667476
4 24.487963 28.839966 26.666242Voila, we have generated a one-year forecast.
Step #4 Analyzing the Forecast
Next, let’s visualize our forecast and discuss what we see. The most simple way is to create the plot with a standard Facebook Prophet function.
Also: Measuring Regression Errors with Python
model.plot(forecast_df, uncertainty=True)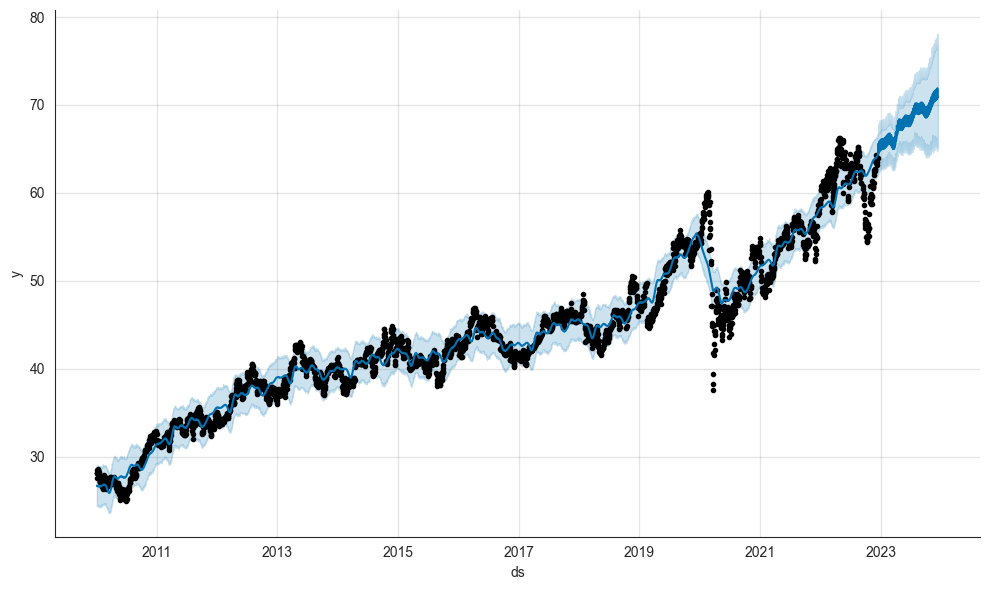
So what do we see? The forecast shows that our model does not simply predict a straight line and instead has generated a more sophisticated forecast that displays an upward cyclical trend with higher highs and higher lows.
- The black dots are the data points from the historical data to which we have fit our model.
- The dark blue line is the most likely path.
- The light blue lines are the upper and lower boundaries of the prediction interval. We have set the prediction interval to 0.85, which means there is a probability of 85% the actual values will fall into this range.
- In total, the model seems confident that the price of Coca-Cola stock will rise within the next year (no financial advice). However, as we will see later, the forecast depends on where the model sees the breakpoints.
In case, you want to create a custom plot, you can use the function below.
# Visualize the Forecast
def visualize_the_forecast(df_f, df_o):
    rolling_window = 20
    yhat_mean = df_f['yhat'].rolling(window=rolling_window).mean()
    # Thin out the ground truth data for illustration purposes
    df_lim = df_o
    # Print the Forecast
    fig, ax = plt.subplots(figsize=[20,7])
    sns.lineplot(data=df_f, x=df_f.ds, y=yhat_mean, ax=ax, label='predicted path', color='blue')
    sns.lineplot(data=df_lim, x=df_lim.ds, y='y', ax=ax, label='ground_truth', color='orange')
    #sns.lineplot(data=df_f, x=df_f.ds, y='yhat_lower', ax=ax, label='yhat_lower', color='skyblue', linewidth=1.0)
    #sns.lineplot(data=df_f, x=df_f.ds, y='yhat_upper', ax=ax, label='yhat_upper', color='coral', linewidth=1.0)
    plt.fill_between(df_f.ds, df_f.yhat_lower, df_f.yhat_upper, color='lightgreen')
    plt.legend(framealpha=0)
    ax.set(ylabel=stockname + " stock price")
    ax.set(xlabel=None)
visualize_the_forecast(forecast_df, df_x)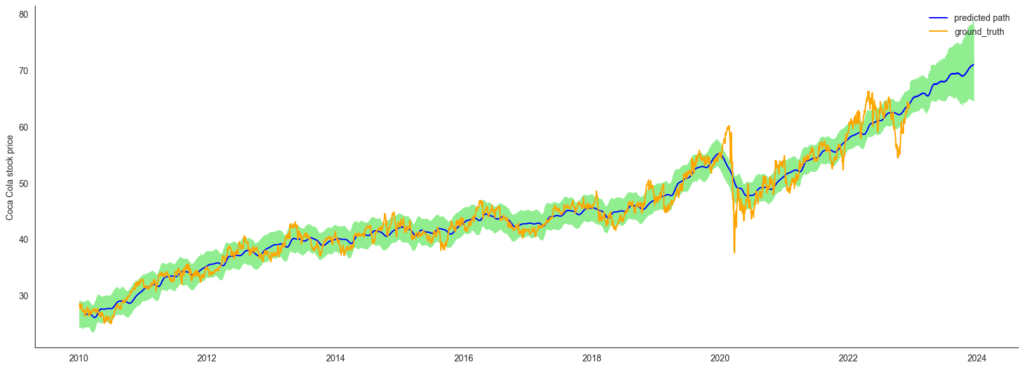
Step #5 Analyzing Model Components
We can gain a better understanding of different model components by using the plot_components function. This method creates a plot showing the trend, weekly and yearly seasonality, and any additional user-defined seasonalities of the forecast. This can be useful for understanding the underlying patterns in the data and for diagnosing potential issues with the model.
model.plot_components(forecast_df)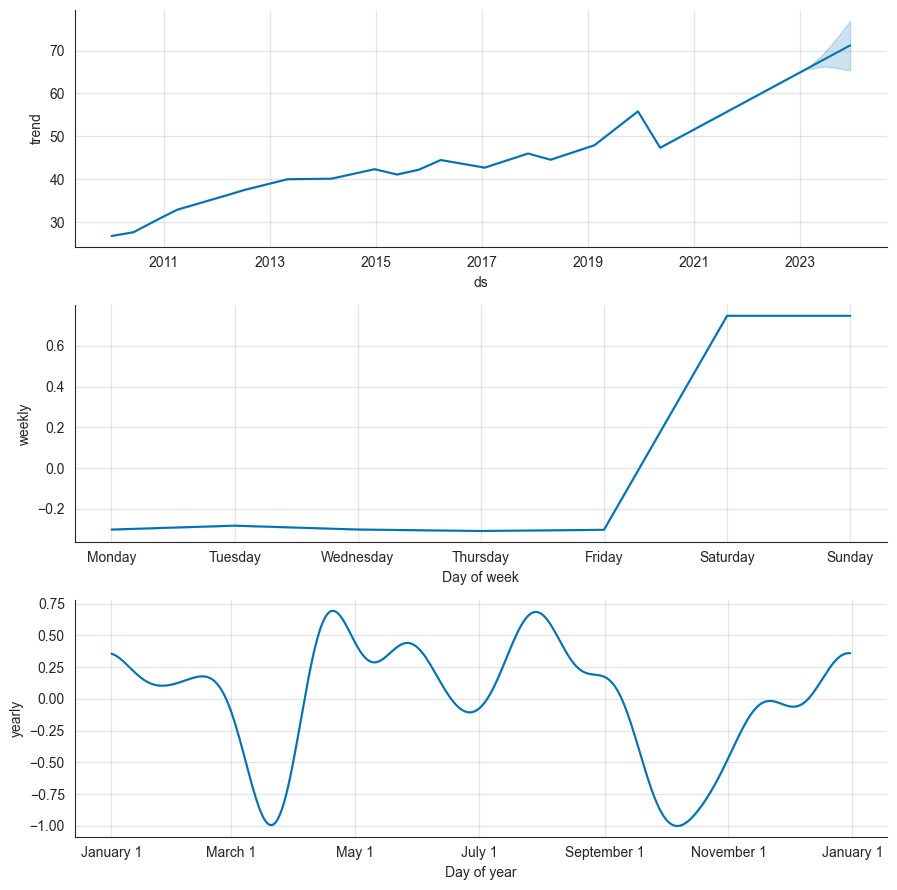
The first chart shows the trendlines that the model sees within different periods. The trendlines are separated by breakpoints about, which we will talk in the next section. When we look at the second plot, we can see no price changes during the weekend. This is plausible, considering that the stock markets are closed over the weekend. The third chart is most interesting, as it shows that the model has recognized some yearly seasonality with two peaks in April and August, as well as lows in March and October.
Step #6 Adjusting the Changepoints of our Facebook Prophet Model
Let’s take a closer look at the changepoints in our model. Changepoints are the points in time where the trend of the time series is expected to change, and Facebook Prophet’s algorithm automatically detects these points and adapts the model accordingly. Changepoints are important to Facebook Prophet because they allow the model to capture gradual changes or shifts in the data. By identifying and incorporating changepoints into the forecasting model, Facebook Prophet can make more accurate predictions. Changepoints can also help to identify potential outliers in the data.
6.1 Checking Current Changepoints
We can illustrate the changepoints in our model with the add_changepoints_to_plot method. The method adds vertical lines to a plot to indicate the locations of the changepoints in the data. By plotting the changepoints on a graph, we can visually identify when these changes in trend occur and potentially diagnose any issues with our model.
# Printing the ChangePoints of our Model
forecast_df, model, future_df = fit_and_forecast(df_x, 365, 1.0)
axislist = add_changepoints_to_plot(model.plot(forecast_df).gca(), model, forecast_df)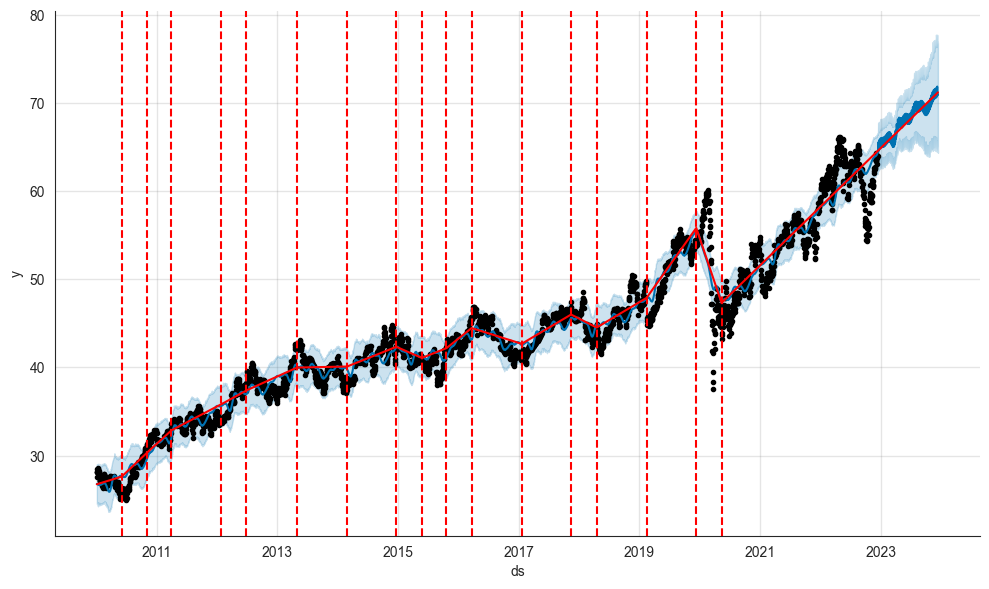
The chart above shows that our model has identified several changepoints in the historical data. However, it has only searched for changepoints within 80% of the time series. As a result, the algorithm hasn’t identified any change points in the most recent years after 2020. We can adjust the changepoints with the changepoint_range (default = 80%) variable. This is what we will do in the next section.
6.2 Adjusting Changepoints
We can adjust the range within which Facebook Prophet looks for changepoints with the “changepoint_range”. It is specified as a fraction of the total duration of the time series. For example, if changepoint_range is set to 0.8 and the time series spans 10 years, the algorithm will look for changepoints within the last 8 years of the series.
By default, changepoint_range is set to 0.8, which means that the algorithm will look for changepoints within the last 80% of the time series. We can adjust this value depending on the characteristics of our data and our desired level of flexibility in the model.
Increasing the value of changepoint_range will allow the algorithm to identify more changepoints and potentially improve the fit of the model, but it may also increase the risk of overfitting. Conversely, decreasing the value of changepoint_range will reduce the number of changepoints detected and may improve the model’s ability to generalize to new data, but it may also reduce the accuracy of the forecast.
Let’s fit our model again, but this time we let Facebook Prophet search for changepoints within the entire time series (changepoint_range=1.0).
# Adjusting ChangePoints of our Model
forecast_df, model, future_df = fit_and_forecast(df_x, 365, 1.0, 1.0)
axislist = add_changepoints_to_plot(model.plot(forecast_df).gca(), model, forecast_df)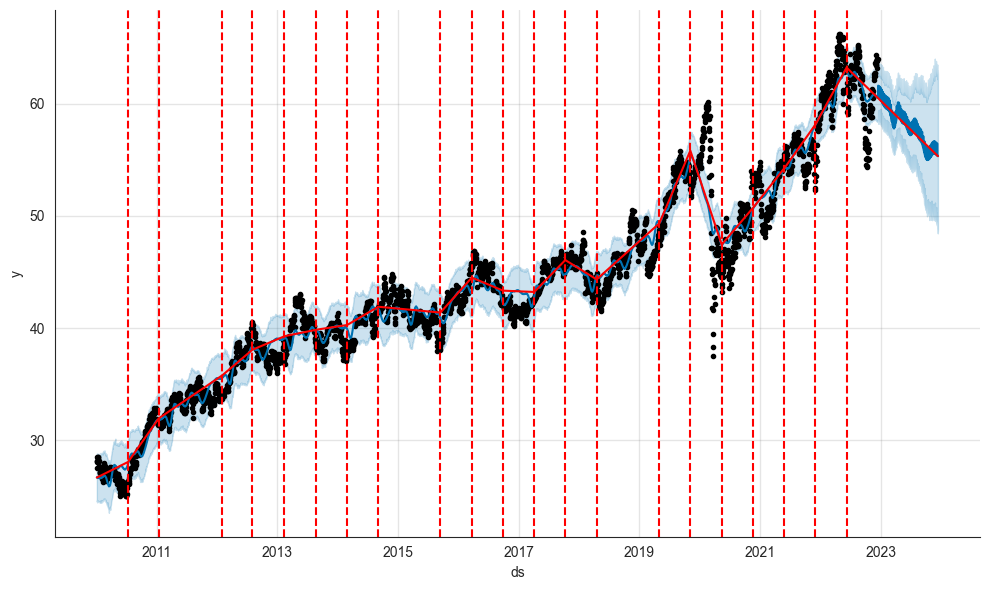
The plot above shows that Facebook Prophet has now identified several additional breakpoints in the time series. As a result, the forecast has become rather pessimistic, as Facebook Prophet gave more weight to recent changes.
Finally, it is worth mentioning that it is possible to add changepoints for specific dates manually. You can try this out using “model.changepoints(series)”. The function takes a series of timestamps as the parameter value.
Summary
Get ready to dive into the world of stock market prediction with Facebook Prophet! In this article, we’ll show you how to leverage the power of this amazing tool to forecast time series data, using Coca-Cola’s stock as an example. We’ll guide you through the process of fitting a curve to univariate time series data and fine-tuning the initial breakpoints and trendlines to enhance model performance. With Facebook Prophet’s automatic trend identification algorithm, you’ll be able to easily adapt to changes in the data over time.
Also: Mastering Multivariate Stock Market Prediction with Python
As a data scientist, you’ll appreciate how easy it is to use Facebook Prophet and how it consistently outperforms other models. With its straightforward interface and impressive accuracy, this tool is a must-have for your forecasting toolkit. And we’re always looking for feedback from our audience, so let us know what you think! We’re committed to improving our content to provide the best learning experience possible.
Sources and Further Reading
- Taylor and Letham, 2017, Forecasting at scale
- github.io/prophet/docs/quick_start.html
- David Forsyth (2019) Applied Machine Learning Springer
The links above to Amazon are affiliate links. By buying through these links, you support the Relataly.com blog and help to cover the hosting costs. Using the links does not affect the price.
Other Methods for Time Series Forecasting


3 Commentsarchived from the original site